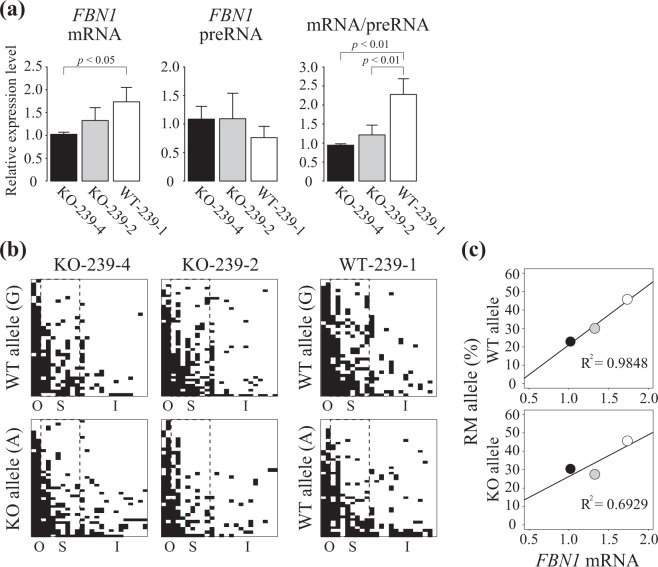
Figure 4.
Allele-distinguished DNA methylation analysis of ear cartilage of the FBN1 het KO pigs. (a) Expression levels of the FBN1 mRNA and preRNA in the ear cartilage of FBN1 het KO (KO-239-4, KO-239-2) and WT (WT-239-1) pigs was measured by RT-PCR. The relative expression levels were normalized to GAPDH expression. The mRNA/preRNA data indicate the ratio of FBN1 mRNA in all transcribed FBN1 RNA. The expression levels are shown as mean ± SD (n = 3). Statistical comparisons of the expression levels were performed using the Student’s t-test, and statistical significance was set as p < 0.05. (b) Allele-distinguished DNA methylation analysis of the same ear cartilage samples from FBN1 het KO and WT pigs was conducted by sodium bisulfite sequencing. Depending on the SNP in the FBN1 CpG island shore, the WT (G) or KO (A) alleles present in the FBN1 het KO pigs were determined in each sequenced read. Although the WT pig analyzed has two WT alleles, one is derived from a WT pig with two G alleles and the other is derived from a WT allele from the FBN1 het KO pig (A). O: hypermethylated outside region. S: variably methylated shore region. I: hypomethylated CpG island. (c) Correlation between FBN1 mRNA level and the RM allele ratio of the S region. Black, gray, and white circles indicate ear-cartilage data from KO-239-4, KO-239-2, and WT-239-1, respectively. In the WT-239-1, the RM allele ratio was calculated using all the sequenced clones of both WT-derived and het-KO-derived FBN1 CpG island shores and was used in both WT- and KO-allele plots without distinguishing the two alleles because two WT alleles were not determined for the WT-239-1 pig in the RT-PCR analysis.

