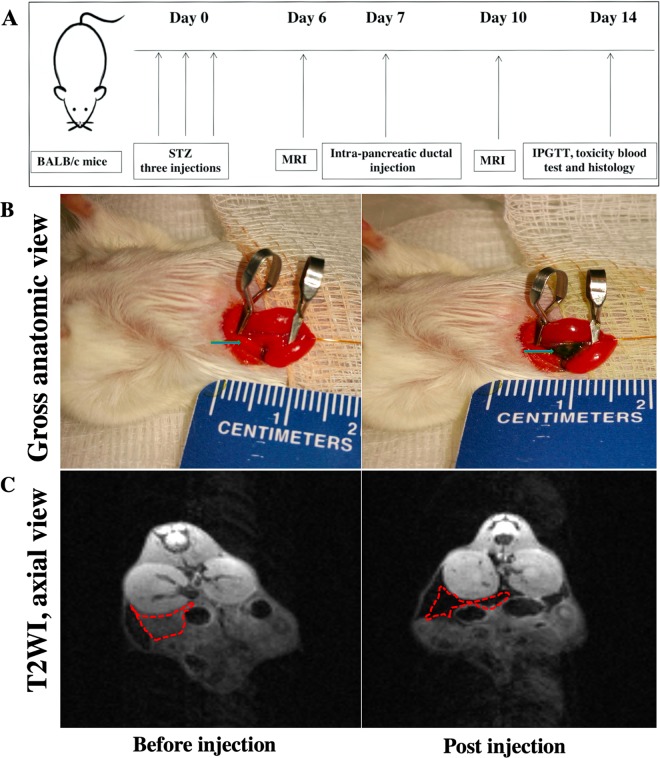
Figure 5.
In vivo MRI of nanodrugs delivery. (A) Experimental flowchart of diabetes induction using streptozotocin (STZ), intra-pancreatic ductal injection of the nanodrugs, magnetic resonance imaging (MRI) and post-injection testing. (B) Gross anatomic images of the pancreatic tissue (green arrow) pre‐ and post- intra-pancreatic ductal injection. Note the pancreatic area turning dark post injection, consistent with diffusion of the nanoparticle solution. (C) Representative MRI of the nanodrug delivery to the pancreas (MN-miRNA is shown). Axial T2‐weighted images showing loss of signal intensity in the pancreatic tissue (red outline) of diabetic animals 72 hours post injection.

