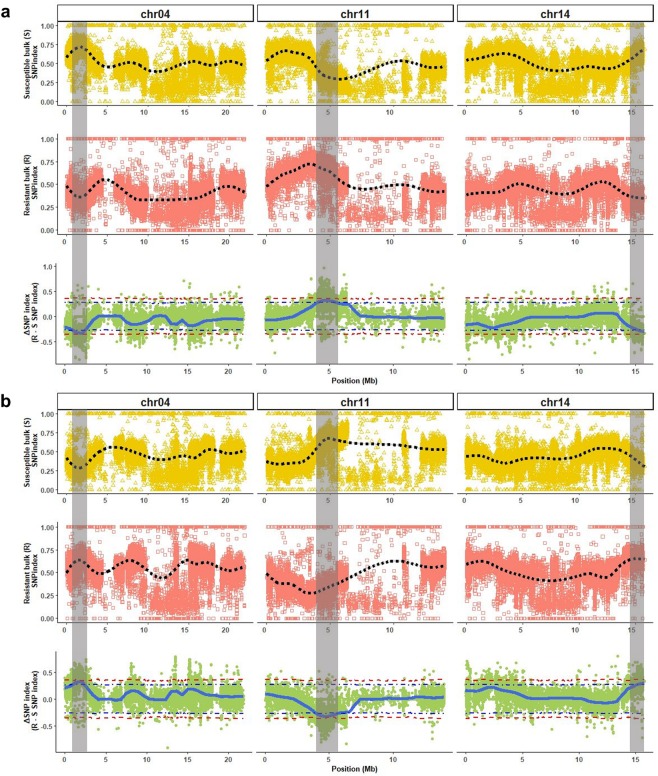
Figure 2.
Quantitative trait loci (QTL) (highlighted in gray) associated with Phytophthora crown rot resistance in Cucurbita moschata on chromosome (chr) 4, 11 and 14 using either #394-1-27-12 (a) or Butterbush (b) as consensus reference genome. The black dotted lines represent the smoothed conditional mean for Susceptible (S) and Resistant (R) bulks SNP indexes, while the blue line represents the tricubeΔSNP for the ΔSNP index. The purple and red dotted lines in the ΔSNP index plot are the 95% and 99% confidence intervals for the regions, respectively.

