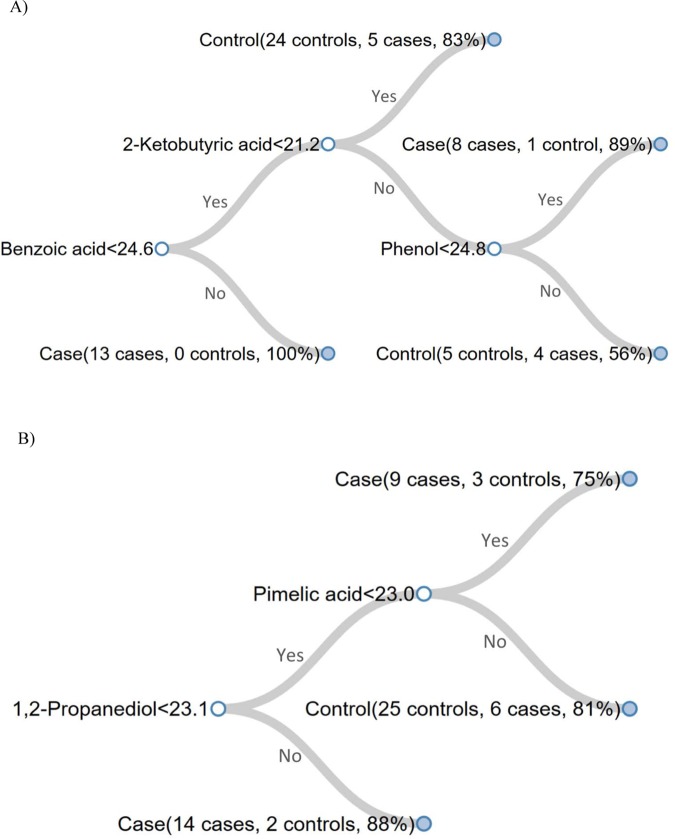
Figure 1.
Classification trees obtained using all samples for Visit 1 (A) Visit 3 (B). In a tree, unfilled circles represent nodes and solid circles represent terminal leaves. Each node shows the name of the metabolite and the rule for splitting. Each leaf, which is termed “case” or “control” based on the rule, lists the number of cases and controls that were classified to the leaf in the CART procedure and the corresponding posterior probability.

