Figure 1.
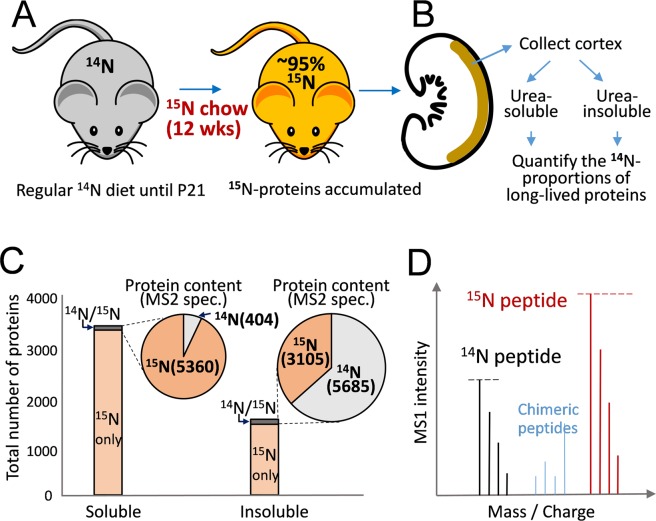
The 15N labeling workflow in conjunction with mass spectrometry identified long-lived proteins in the kidney cortex. (A) C57BL/6 J mice were subjected to an exclusive 15N chow starting on P21 for 12 consecutive weeks. 15N was incorporated into newly synthesized proteins (represented by red color). (B) Three kidneys from three mice were used to collect the cortex tissues (marked with brown color), which were then combined and extracted for proteins using 8 M urea solution. The samples were fractionated into urea-soluble and urea-insoluble fractions and separately digested with Trypsin/Lys-C endopeptidases. The resulting peptides were detected as either fully 14N- or fully 15N-peptides by LC-MS/MS and the remaining 14N-content of each individual protein as the proportion of the total protein amount was calculated. (C) In the bar graph, the total number of individual proteins detected either through their 14N- or 15N-peptides were counted. In total, 3482 individual proteins were detected from the urea-soluble fraction and 1562 from the urea-insoluble fraction, of which the majority proteins with the exceptions of 87 and 109 proteins respectively were identified only by their labeled 15N peptides. As shown in the pie-chart insets, between the 87 and 109 protein groups we evaluated their 14N versus 15N contents as a whole based on the sum of MS2 spectral counts of all proteins in each group (value in parenthesis). Clearly, the soluble fraction contained more than 10 times less remaining 14N proteins in total quantity, 404 versus 5685 spectra. (D) In order to calculate the proportions between 14N and 15N contents of an individual protein, we relied on the MS1 intensity values of its peptide spectra (represented by the black and red spikes respectively), and collectively calculated the composite ratios of respective under-curve-areas based on the reconstructed chromatographs of corresponding 14N versus 15N peptide pairs (not shown, details in Methods). Chimeric peptides shown in blue represent partially labeled peptides that contained both 14N and 15N, which were not accounted for in the calculation of 14N proportion of individual proteins. The figures were created in Adobe Illustrator v24.0 (https://www.adobe.com/products/illustrator.html).

