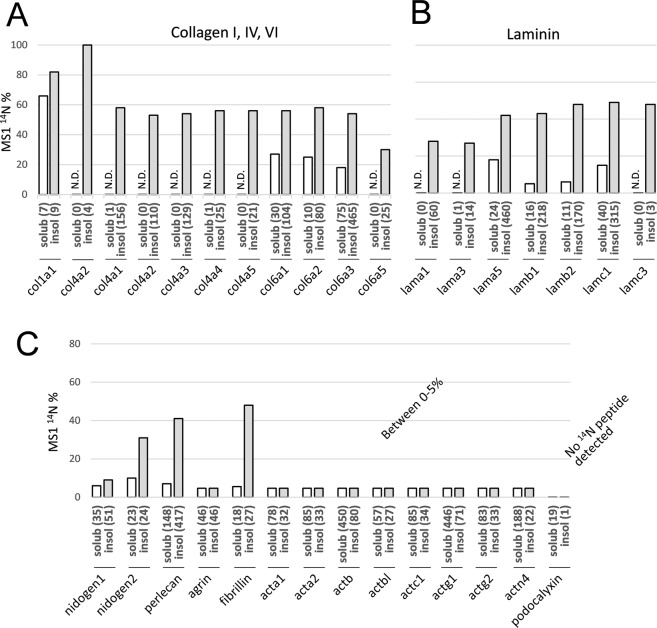
Figure 3.
Comparison of remaining 14N percentage among individual proteins in urea-soluble versus insoluble fractions. (A,B) Individual collagen and laminin proteins with their total levels (value as MS2 spectral count in parenthesis) and remaining 14N percentage (y-axis value) separately compared between their urea-soluble (open bar) and insoluble isolates (filled bar). Note that proteins in the soluble fraction had either no or less 14N proportions than their insoluble counterparts. (C) Other GBM proteins such as nidogen, perlecan and fibrillin all had the similar profile, whereas cytoskeletal actin, although more abundantly harvested in the soluble fraction (spectral count value in parenthesis), with its insoluble contents completely turned over to 15N.

