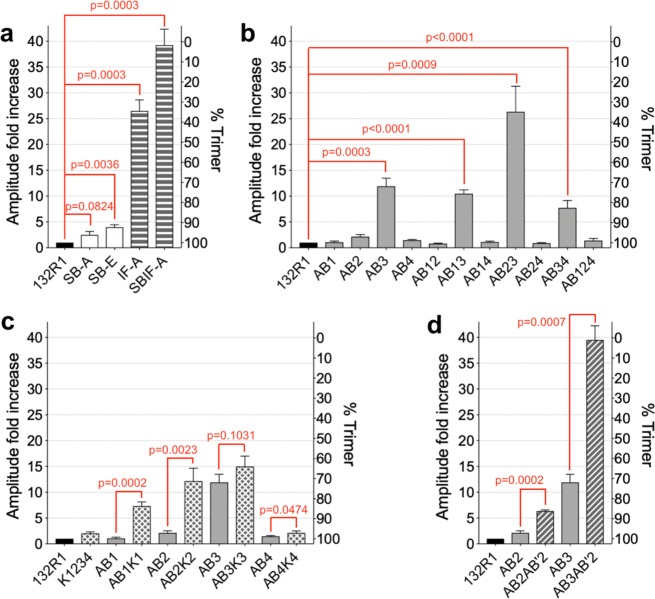
Figure 4.
ANXB12 trimer formation estimated from EPR amplitudes. The amplitudes of the EPR spectra for the various mutants are shown as fold increase relative to the amplitude of 132R1. All amplitudes are those of spin normalized EPR spectra obtained in triplicates. The second y-axis shows the percentage of trimer formation, which is inversely proportional to the relative amplitude. The mutants are grouped into disruption of (a) protein-protein interactions, (b) AB Ca2+-binding ligands, (c) lysine introduction into the AB loops and (d) simultaneous disruption of ligands in the AB and AB′ Ca2+-binding sites. The mutant names are explained in Table 1. The bars represent average values of independent repeats (n = 3) with standard deviation. Two-tailed unpaired t-tests were performed for selected mutant pairs and P-values are shown (red). Data analysis was performed in GraphPad Prism 8.0.

