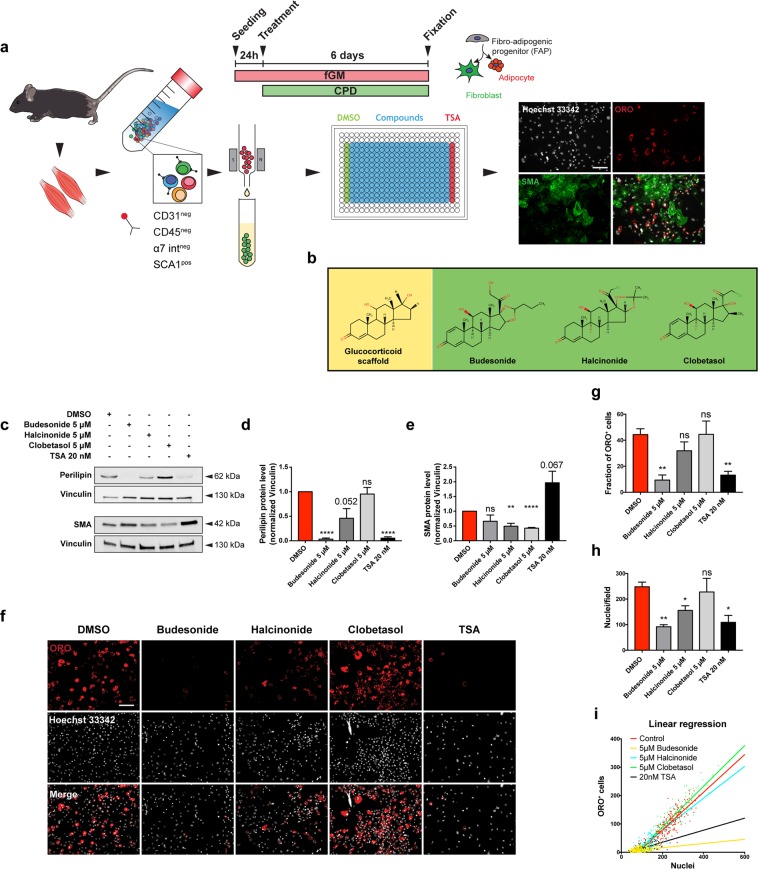
Figure 1.
Budesonide affects FAP adipogenic differentiation. (a) Schematic representation of the experimental procedure for the screening of Prestwick chemical library using mdx FAPs. Once isolated, FAPs from mdx mice were incubated for 7 days in fGM. 24 hours upon plating, cells were treated with the compounds of the Prestwick library at the final concentration of 5 μM for further 6 days. Cells were then stained with ORO (red) to reveal adipocytes, an antibody against SMA (green) to reveal fibroblasts while Hoechst 33342 was used to stain the nuclei (grey). (b) Structures of the GCs scaffold, budesonide and halcinonide and clobetasol. (c) Mdx FAPs were plated in fGM and after 24 hours cells were treated for further 6 days with 5 μM budesonide or halcinonide or clobetasol while TSA was used as positive control of adipogenic inhibition. Representative western blot showing perilipin and SMA expression in crude protein extracts. 30 μg of cell extracts were loaded in each lane. Vinculin is used as a loading control. The blot showed is a grouped image obtained from the crop of different gels. Full-length blots are included in Supplementary Information (Fig. S10). (d,e) The bar graphs illustrate the densitometric quantitation of perilipin and SMA expression for the experiment reported in c. (f) Immunofluorescence images showing ORO (red) and Hoechst 33342 (gray) staining for mdx FAPs treated as in c. (g,h) Bar plots showing the fraction of ORO positive cells and the number of nuclei/field for the experiment reported in f. (i) The dot plot illustrates the number of adipocytes onto the total nuclei number of nuclei in each field with the relative trend lines for the experiment reported in f. The values are means of three independent experiments ± SEM (n = 3). Statistical significance was evaluated using the Student’s t-test (*p ≤ 0.05, **p ≤ 0.01, ****p ≤ 0.0001, ns: not significant). Scale bar: 100 μm.

