Figure 2.
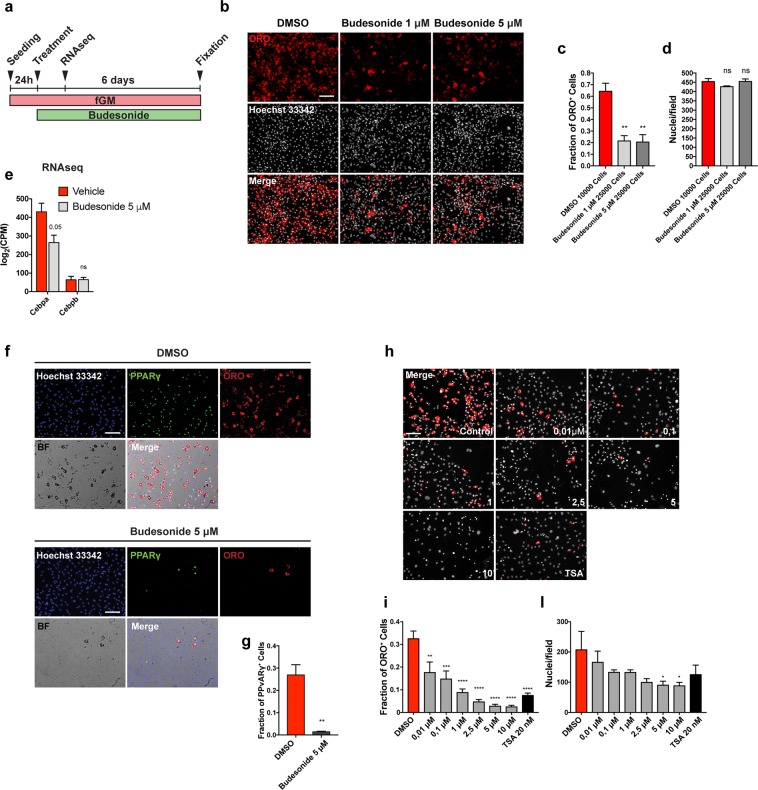
Budesonide inhibits PPARγ expression during mdx FAP differentiation. (a) Schematic representation of the experiments reported in b, e, f, h. (b) Upon isolation, mdx FAPs were plated at different confluences: 10,000 cells/well for control and 25,000 cells/well for budesonide treated cells in a 96 well plate. 24 h upon isolation, FAPs were treated with 1 μM and 5 μM budesonide for 6 additional days and then stained with ORO (red) to reveal adipocytes and with Hoechst 33342 (grey) to reveal nuclei. (c,d) Bar plots showing the fraction of ORO positive cells and the average number of nuclei per field for the experiment reported in b, (e) Log2CPM expression levels for Cebpa, Cebpb and Gli genes. Expression data were extrapolated from the RNAseq experiment in which FAPs were treated with vehicle (DMSO) or 5 μM Budesonide for 24 hours. A post-hoc t-test has been applied and defined as *p ≤ 0.05, **p ≤ 0.01, ****p ≤ 0.0001, ns: not significant. (f) Immunofluorescence images showing mdx FAPs treated with 5 μM budesonide for 6 days and then stained with ORO (red) and an antibody against PPARγ (green). Nuclei are counterstained using Hoechst 33342 (blue). (g) Bar plot representing the fraction of PPARγ positive cells for the experiment reported in f. The values are means of three independent experiments ± SEM (n = 3). Statistical significance has been evaluated using the unpaired T-Test (**p ≤ 0.01). (h) Representative microphotographs of mdx FAPs treated with increasing concentrations of budesonide or with 20 nM TSA. FAPs are stained with ORO (red) and Hoechst 33342 for nuclei (grey). (i,l) Bar plots showing the fraction of ORO positive cells for each concentration of budesonide and the number of nuclei in each field for controls and after treatment with budesonide. The values are means of three independent experiments ± SEM (n = 3). Statistical significance has been evaluated using one-way ANOVA (*p ≤ 0.05, **p ≤ 0.01, ***p ≤ 0.001, ****p ≤ 0.0001, ns: not significant). Scale bar: 100 μm.

