Figure 5.
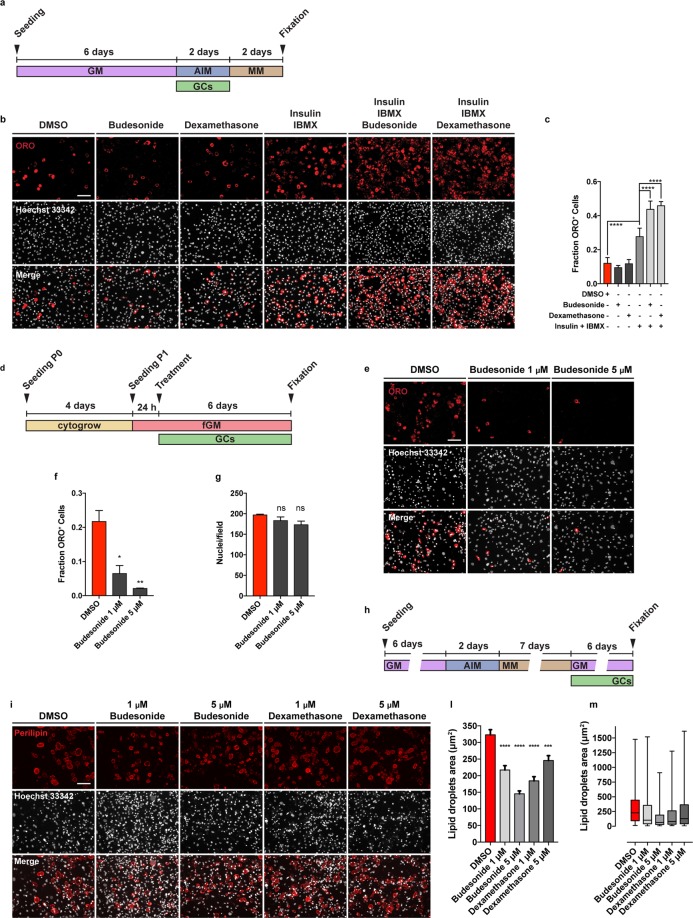
Different effect of GCs on adipogenic differentiation depending on the timing of their administration. (a) Schematic representation of the experiment reported in b, mdx FAPs were isolated by the standard procedure and plated in GM. 6 days post-seeding, confluent cells were treated with 1 μM of budesonide or dexamethasone either with or without the AIM (10% FBS, 1 μg/mL of insulin, 0.5 mM IBMX) for 2 days. Cells were then moved to MM (10% FBS and 1 μg/mL of insulin) and incubated for 2 additional days. (b) Immunofluorescence microphotographs of cells stained with ORO to reveal adipocyte formation (red) and Hoechst 33342 (grey). (c) Bar plot showing the fraction of ORO positive cells for the experiment reported in panel b. (n = 3–4) ± SEM. Scale bar: 100 μm. (d) Schematic representation of the experiment reported in e, FAPs isolated from young mdx mice were expanded in Cytogrow for 4 days until they reached 70% confluence. Cells were then detached and plated in fGM. 24 hours after seeding cells were treated with 1 μM or 5 μM budesonide for 6 days. (e) FAP adipogenic differentiation was assessed by staining cells with ORO (red) and Hoechst 33342 (grey). (f,g) Bar graphs presenting the quantitation of the adipogenic differentiation and the number of nuclei per field for the experiment in panel e. (n = 2) ± SEM. (h) After 6 days in GM, P1 (expanded in Cytogrow medium) mdx FAPs were moved to AIM for 48 hours followed by 7 days in MM to obtain mature adipocytes. Mature adipocytes were exposed to either budesonide or dexamethasone at different concentrations in growth medium for 6 additional days. (i) Immunofluorescence images of FAPs stained with an antibody against perilipin to reveal lipid vesicles (red) and Hoechst 33342 to reveal nuclei (gray). (l,m) Lipid droplets area for the experiment reported in showed as bar plot or box plot respectively (n = 2). Statistical significance tested by one-way ANOVA (*p ≤ 0.05, **p ≤ 0.01, ***p ≤ 0.001, ****p ≤ 0.0001, ns: not significant). Scale bar: 100 μm.

