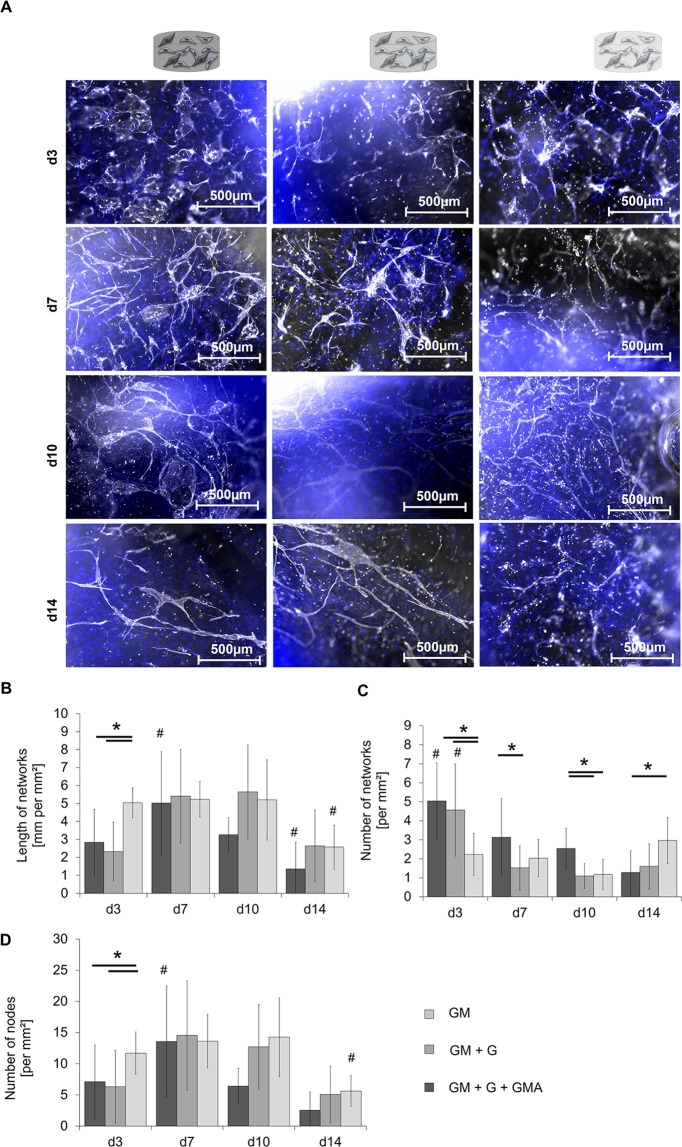
Figure 4.
Qualitative and quantitative analysis of capillary-like structures in different hydrogel variants based on GM, GM + G or GM + G + GMA in ASCs-HDMECs co-culture. (A) Staining of PECAM-1 in three hydrogel variants on day 3, day 7, day 10, and day 14 of culture. PECAM-1 is shown in white, the DNA in blue. Scale bar 500 µm. (B) Total length of the formed network in mm per mm². (C) Number of networks per mm² and (D) number of nodes per mm² in the formed networks. Shown are the mean values from three independent experiments and the respective standard deviations. Statistically different means (p < 0.05) are marked as follows: # significantly different to all analysis days of the same hydrogel variant; *significantly different between the two conjoined hydrogel variants. (Partly reproduced from49).

