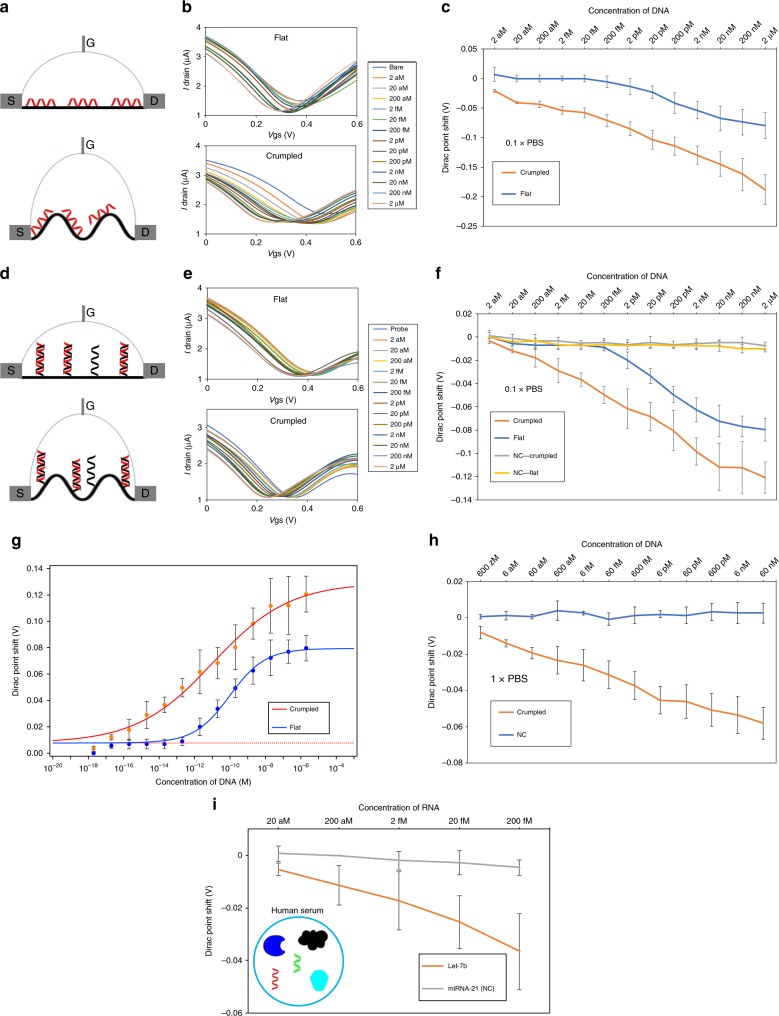
Fig. 2. Nucleic acids absorption and hybridization test on flat and crumpled FET.
a Lateral image of the flat (top) and crumpled (bottom) graphene FET DNA sensors. DNA (red strand) is absorbed on the graphene surface by π-π stacking. b I–V relationship of the flat (top) and crumpled (bottom) graphene FET sensors for the DNA absorption. DNA absorption shifted the I–V curve according to the indicated concentrations. The I–V curves shift of crumpled graphene is significantly larger than the flat device. c Dirac voltage shift of the FET sensor. The Dirac voltage shift is plotted as a function of the added target DNA concentration. d Lateral image of the flat (top) and crumpled (bottom) graphene FET DNA sensors. DNA (red strand) is hybridized with probe DNA (black strand) on the graphene surface. e I–V relationship of the flat (top) and crumpled (bottom) graphene FET sensors for the DNA hybridization. DNA hybridization shifted the I–V curve according to the indicated concentrations. The I–V curves shift of crumpled graphene is significantly larger than the flat device. f Dirac voltage shift of the FET sensor with detection of hybridization using DNA probe. NC is non-complementary control sequences used in the experiments. g Sips model fitting results Y-axis is absolute values of Dirac point shift. h Dirac voltage shift of the FET sensor with detection of hybridization using PNA probe. i Dirac voltage shift of the FET sensor with miRNA detection of hybridization. Target RNA spiked in human serum was treated on the FET sensor. Human serum is complex mixture of biological components. The DNA and RNA sequence used in the experiments is shown in Supplementary Table 1. All the data points are obtained from three different devices. mean ± std. *P < 0.05.

