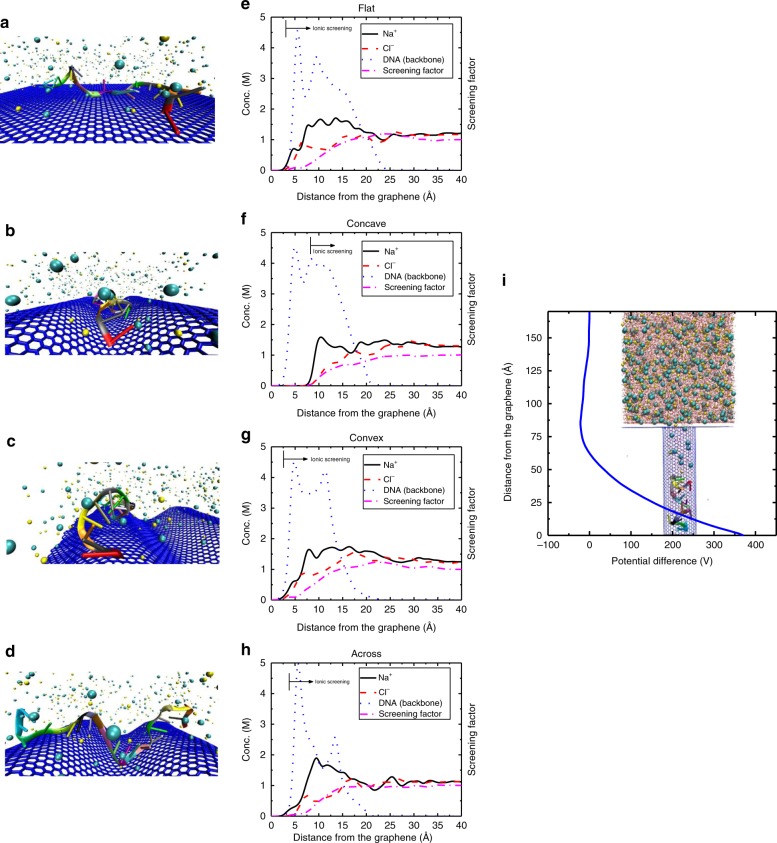
Fig. 3. The schematic of the simulations for equilibrated DNA on.
a Flat graphene, b concave surface of crumpled graphene, c convex surface of crumpled graphene, and d across the graphene crumples. Graphene is shown in blue, ions are presented as cyan and yellow spheres and the DNA bases are shown in different colors. Water molecules are not shown for better presentation. The molar concentration of ions (sodium and chloride) and the backbone of DNA strand along with the screening factor of ions are plotted as a function of the distance from the graphene surface for e flat, f concave, g convex, and h across configurations of DNA. The location where the ionic screening starts to take place is shown using an arrow. In the concave region, ions are excluded due to its confinement and most of the adsorbed DNA molecule remains unscreened electrostatically. Less screening increases and induces more charge density in graphene resulting in a larger Dirac point shift. i The 2.45-nm diameter CNT that is used to model a narrow trench in crumpled graphene, is shown with CNT and graphene carbon atoms in blue, ions in cyan and yellow, water molecules in red and DNA strand bases in different colors. The DNA adsorbs to the bottom of the trench and excludes ions near the surface (maximizing ). The resulting giant electric potential modifies the carrier charge density of graphene. The potential is obtained from , where q(z), A and εo are the net charge of the system (ions, DNA and water) in z, surface area of the bottom of the trench and vacuum dielectric constant, respectively.

