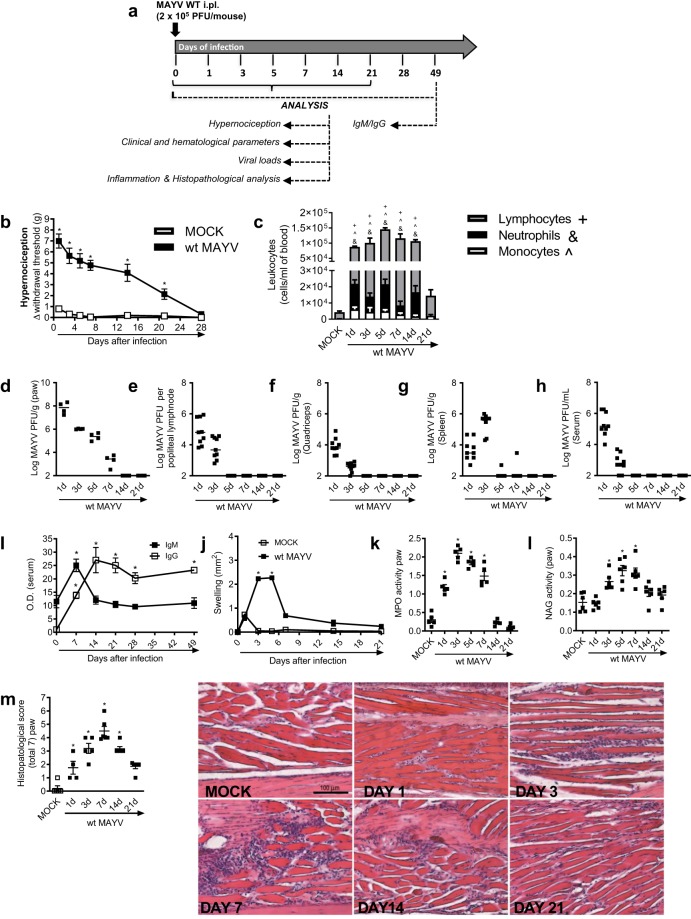
Figure 1.
Characterization of MAYV disease in immunocompetent mice. (a) Experimental scheme. 6-week-old BALB/c mice were infected or not with wt MAYV (2 × 10⁵ PFU/50 μL, i.pl.) and several analyses were performed along the kinetic of infection. (b) Mechanical hypernociception was assessed daily. Results are shown as the differences (Δ) between the force (g) necessary to induce dorsal flexion of the tibio-tarsal joint, followed by paw withdraw, calculated by subtracting zero-time mean measurements before MAYV inoculation from the time interval mean measurements after infection. (c) Total and differential cell counts of inflammatory cells in the blood. (d–h) Plaque assay analysis of hind paw (d), LNP (e), quadriceps muscle (f), spleen (g) and serum (h). (i) Anti-MAYV IgM and IgG titers of pre- and post-infection serum samples collected on day zero and every 7 days until day 49. (j) MAYV-induced footpad swelling was assessed daily by measuring the height and width of the perimetatarsal area of the hind foot. Results are shown as mm2. (k) Neutrophil influx to the hind foot was measured indirectly by evaluation of MPO activity. (l) Macrophage influx to the hind foot was measured indirectly by analysis of NAG activity. (m) Shows semi-quantitative analysis (histopathological score) of hind paw sections of mock- and MAYV-infected mice, 1, 3, 7, 14 and 21 d.p.i. Representative pictures from hind paw sections. Results were expressed as median (d–h) or mean ± SEM (b,c and i–m) and are representative of two experiments. Original magnification: 200×. Scale bar: 100 µm. *p < 0.05 when compared to control uninfected mice (MOCK), as assessed by two-way (b,i,j) or one-way ANOVA followed by Newman-Keuls post-test (k-m). +, &, ^p < 0.05 (for lymphocytes, neutrophils and monocytes, respectively) when compared to control uninfected mice (MOCK), as assessed by one-way ANOVA followed by Newman-Keuls post-test (c).

