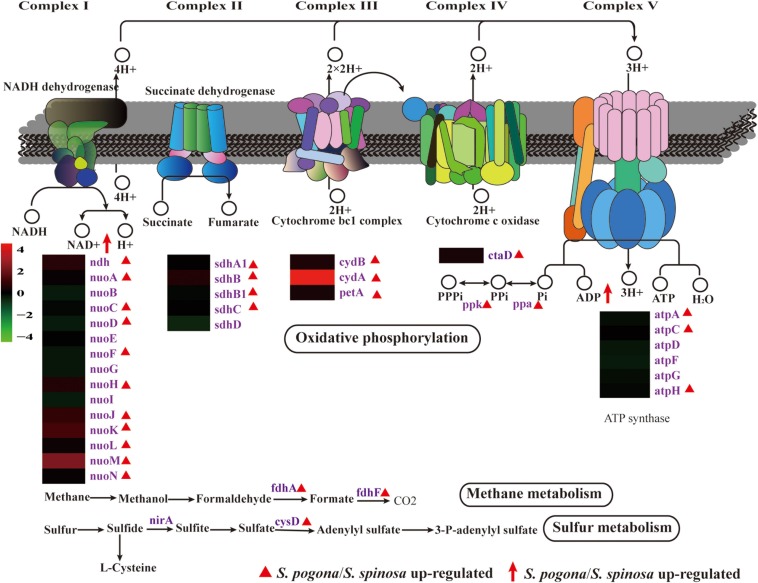
FIGURE 7.
Protein and metabolite changes of energy metabolism in S. pogona and S. spinosa. The protein changes are from iTraq-labeled identification results. The proteins identified are indicated in purple. The proteins indicated in triangle pattern (red) represent significant differences in S. pogona. The metabolite changes are from metabolomic analysis results. The metabolites indicated in arrow (red) represent significant differences in S. pogona.

