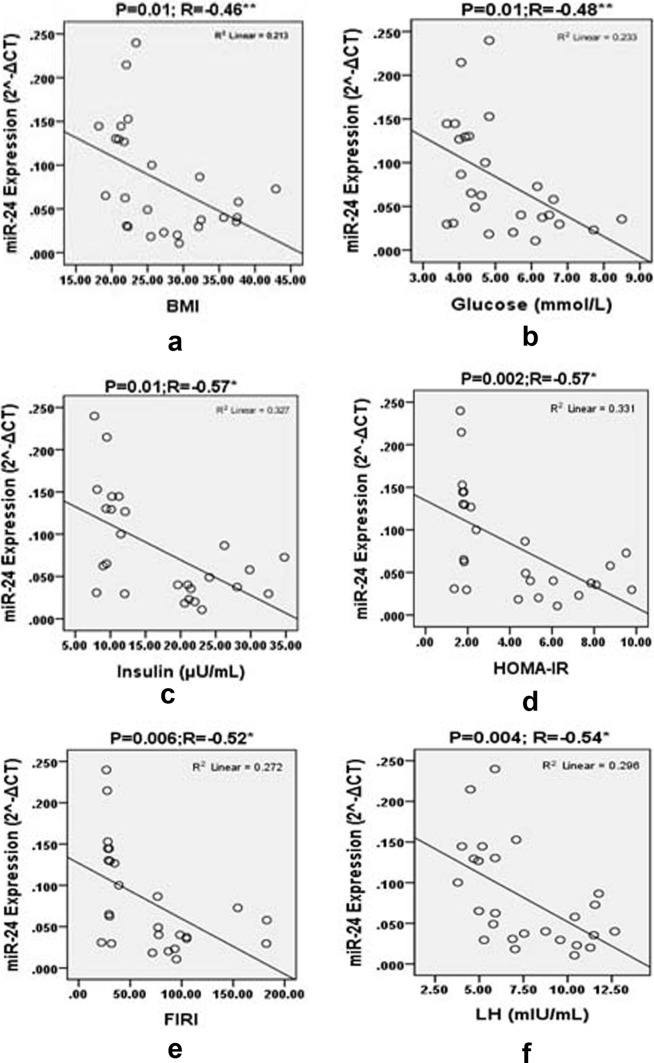
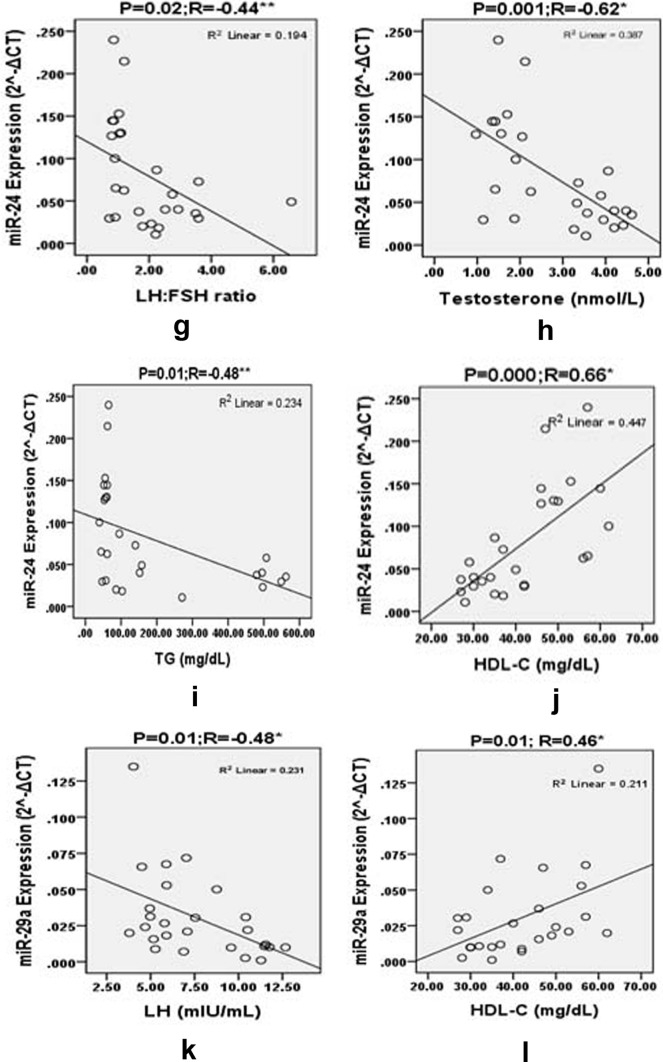
Fig. 3.
Pearson correlation plots for the expression levels () of miRNA-24 with BMI, glucose, insulin, HOMA, FIRI, LH, LH:FSH ratio, testosterone, TG, HDL-C and miRNA-29a with LH and HDL-C in the groups studied. “r” values represents the correlation coefficients in the scatter plots diagram. P significant *< 0.01 and **< 0.05


