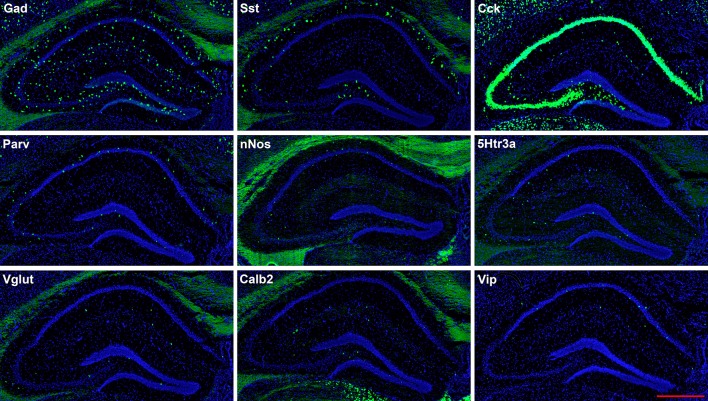
Figure 2.
Representative low-magnification photomicrographs showing expression of nine interneuron types in sections 1.8 mm behind the bregma. This is the level at which the interneurons were counted. See Figure 1 for hippocampal layer and region delineations. White matter tracts show some autofluorescence (green) in some panels. In this and subsequent figures, Gad and Vglut stand for Gad-1 and Vglut3, respectively. The bar equals 500 μm for all panels.

