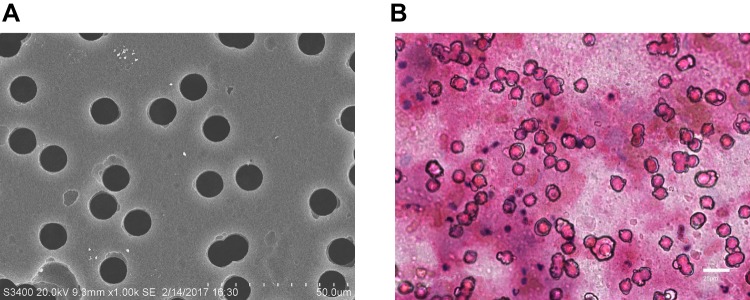
Figure 2.
CTC enrichment and identification. (A) SEM images of nuclear track membranes (original magnification 1000; bar, 50um). (B) HE staining of CTCs in patients’ blood samples: A representative example of CTC, characterized by a large and irregular nucleus and presence of nucleoli (original magnification 400; bar, 25um).

