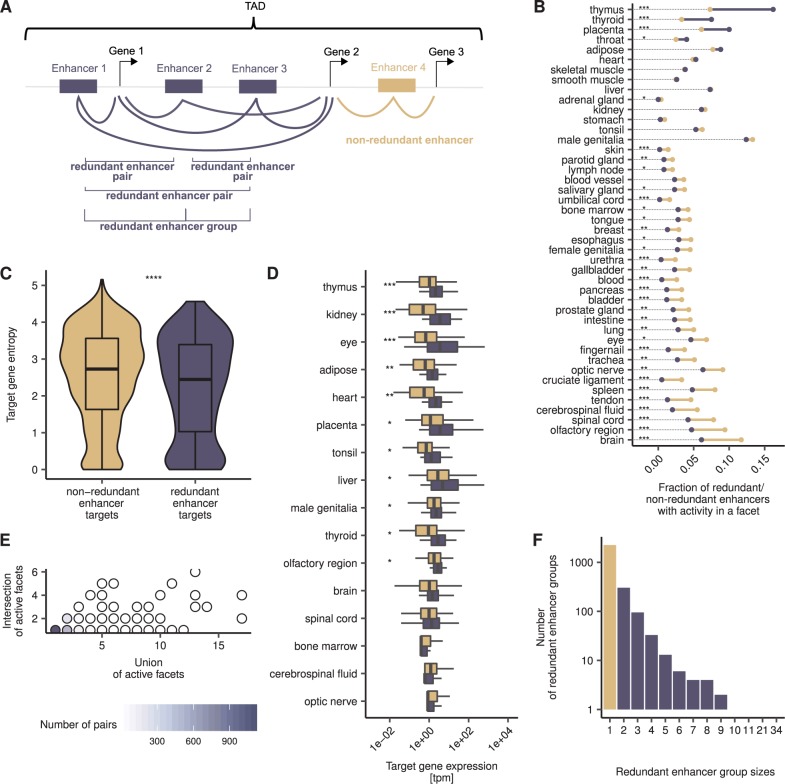
Fig. 1.—
Redundant enhancers show distinctive features. (A) Enhancers are assigned to target genes, further categorized into redundant and nonredundant enhancers, arranged into redundant enhancer pairs and redundant enhancer groups. If the activity profiles of two enhancers within a TAD are moderately significantly correlated with the activity profiles of the same set of promoters, then the two enhancers are considered a “redundant enhancer pair” and the genes associated with the promoters, their target genes. Significant correlations are shown as lines between enhancers and genes. All redundant enhancer pairs associated with the same target genes form a redundant enhancer group. (B) Some facets show strong enrichments for active redundant enhancers (e.g., thymus) and some show strong depletions (e.g., brain). The dumbbell plot shows the fractions of active nonredundant (beige) and redundant (purple) enhancers per facet. The facets are sorted according to the difference in the fractions of redundant and nonredundant enhancers; if the fraction of active nonredundant enhancers is larger than that of redundant enhancers, the line between the dots is depicted in beige; otherwise, in purple. The dotted lines serve as visual aids. Asterisks indicate FDR-corrected P values of Fisher’s exact tests: *P < 0.05, **P < 0.01, ***P < 0.001. (C) Redundant enhancer target genes are more tissue-specific than nonredundant enhancer target genes. Depicted are the entropies of nonredundant (beige) and redundant (purple) enhancer target genes. Asterisks indicate P value of Wilcoxon rank-sum test. ****P < 0.0001. (D) In most facets, redundant enhancer target genes show a stronger expression than nonredundant enhancer target genes. Facet-specific expression of nonredundant (beige) and redundant (purple) enhancer target genes with FDR-corrected P values of Wilcoxon rank-sum tests. The facets are sorted according to FDR-corrected P values. See (B) for significance code. (E) The majority of redundant enhancer pairs have a 100% overlapping activity pattern. Regulatory redundancy of redundant enhancer pairs is measured as the ratio of the number of facets with shared activity to the number of facets in which any of the partners of the pair is active. (F) Redundant enhancers form groups of different sizes. Depicted are the number of nonredundant enhancers (beige) and redundant (purple) enhancer in a group.

