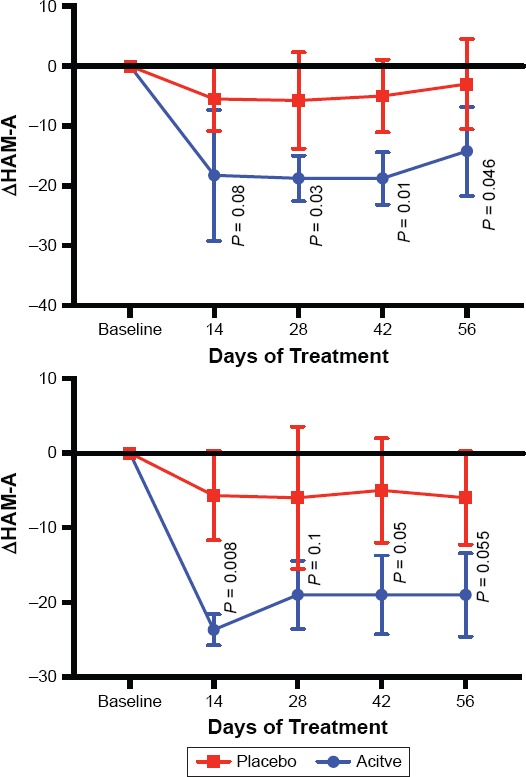
Figure 2.

The Mean Change from Baseline in HAM-A Total Scores Throughout the Study
Top is the entire sample, bottom is the 6 individuals who have the short form of the serotonin transporter. Graphed numbers are means +/− standard deviation.

The Mean Change from Baseline in HAM-A Total Scores Throughout the Study
Top is the entire sample, bottom is the 6 individuals who have the short form of the serotonin transporter. Graphed numbers are means +/− standard deviation.