Fig. 1.
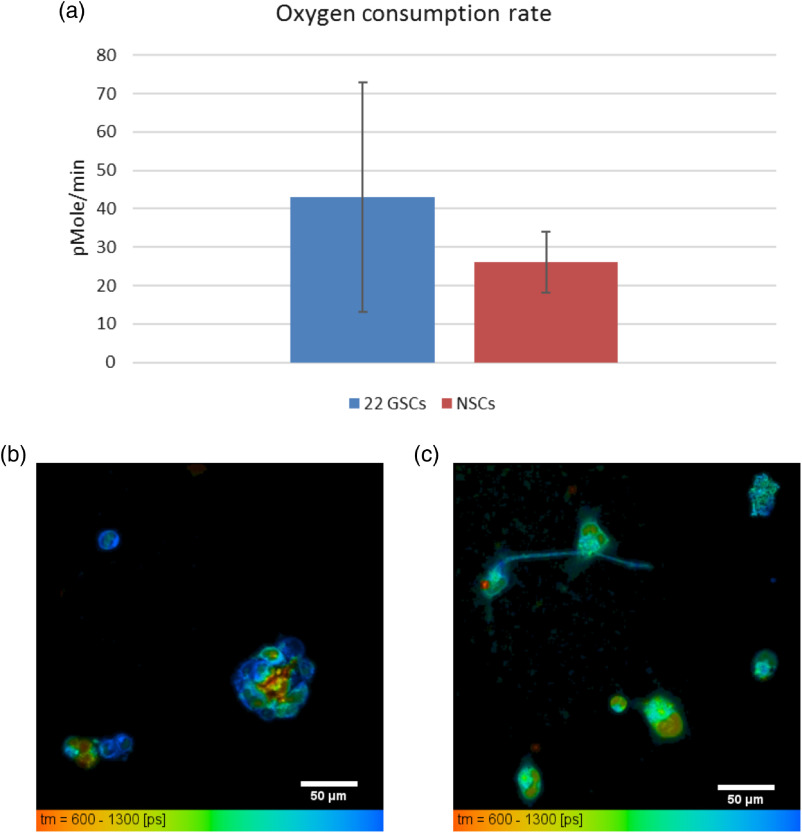
Live 22 GSC cells have increased OCR and corresponding increased mean NADH lifetimes and increased amount of bound NADH () compared with NSCs. (a) OCR basal measurements taken with Seahorse XF (Agilent) assay by seeding 17 wells with . Mean OCR for versus (Student’s -test, ). Error bars represent standard deviations. FLIM measurements taken on same cell lines with custom multiphoton microscope. Mean NADH lifetimes for (b) 22 GSCs , versus (c) NSCs , (Student’s -test, ). Scale bars are .

