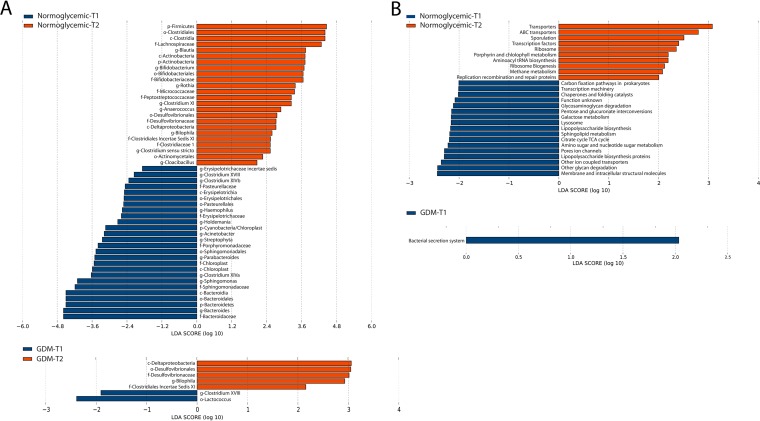
FIG 2.
Dynamic changes of gut microbiota from T1 to T2. (A and B) Differential taxa (A) and functions (B) generated by LDA. Red bars indicate bacterial taxa and functions with significantly greater relative abundance in T2; blue bars indicate bacterial taxa and functions with greater relative abundance in T1. TCA cycle, tricarboxylic acid cycle.

