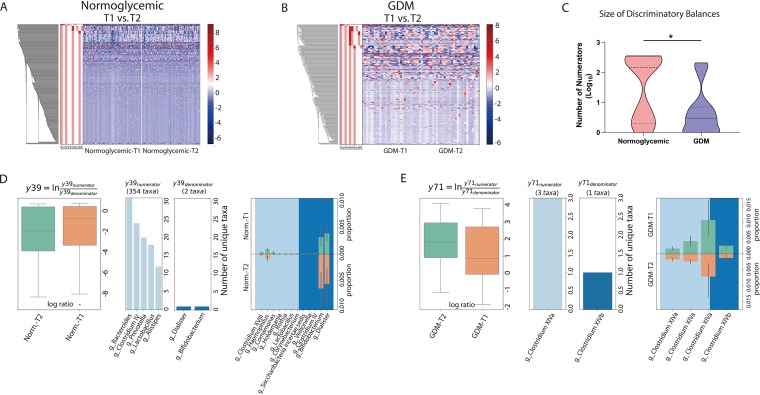
FIG 4.
(A and B) Balance tree analysis of the inter-time point microbiota differences in the normoglycemic (A) and GDM (B) groups. (C) Taxon number comparison of the inter-time point discriminatory balances (FDR < 0.1) between the control and GDM groups. (D and E) Representative large inter-time point discriminatory balance in the control (D) or GDM (E) group. The traits of each branch presented in panels D and E include log ratio, taxonomic composition, and T1-T2 proportions of individual taxa. Norm., normoglycemic.

