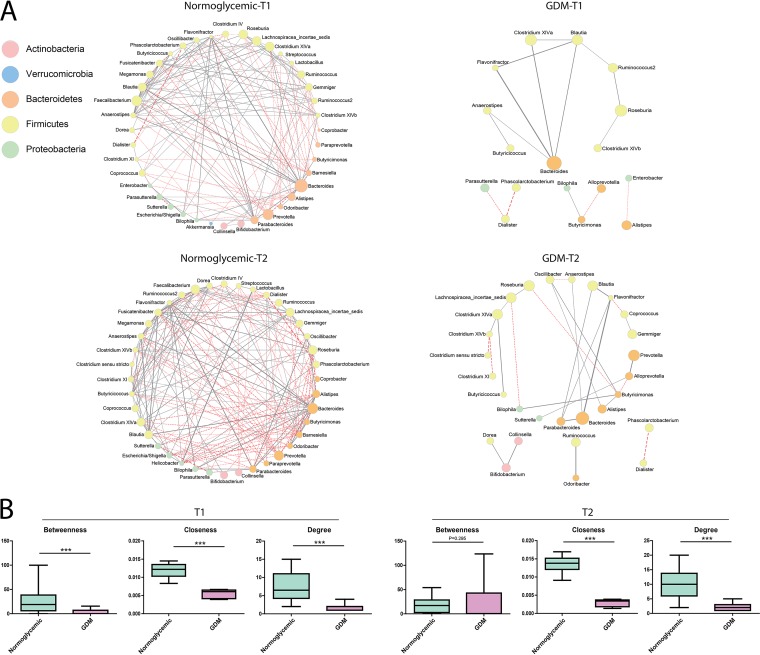
FIG 5.
Patterns of bacterial interactions between women with GDM and control groups in T1 and T2 by cooccurrence network analysis (A) and statistical comparison of the topological variables (B). Lines between nodes represent the interbacterial correlations (edges), and gray solid lines and red dashed lines indicate positive and negative correlations, respectively. Green boxes represent women in the normoglycemic group; pink boxes represent women in the GDM group.

