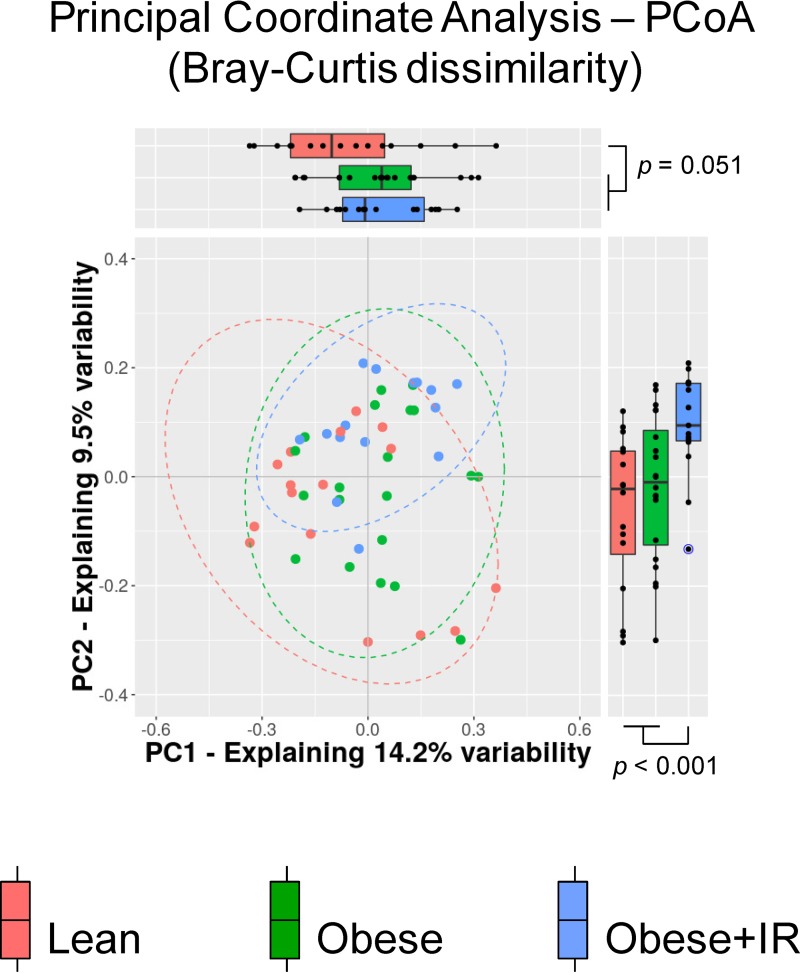
FIG 1.
Beta diversity of the gut microbiota profiles from normal weight and obese children. A principal-coordinate analysis (PCoA) of dissimilarities among samples is shown, with marginal boxplots disclosing the distribution of the two most informative principal coordinates (PC) of the multidimensional analysis. Blue data points correspond to outliers. The color key for the scatter- and boxplots indicate the study groups of children. PERMANOVA values = 2.08 and 1.68 (P < 0.005) for comparison using two-group (lean versus obese) and three-group (lean versus obese versus obese+IR) configurations, respectively.

