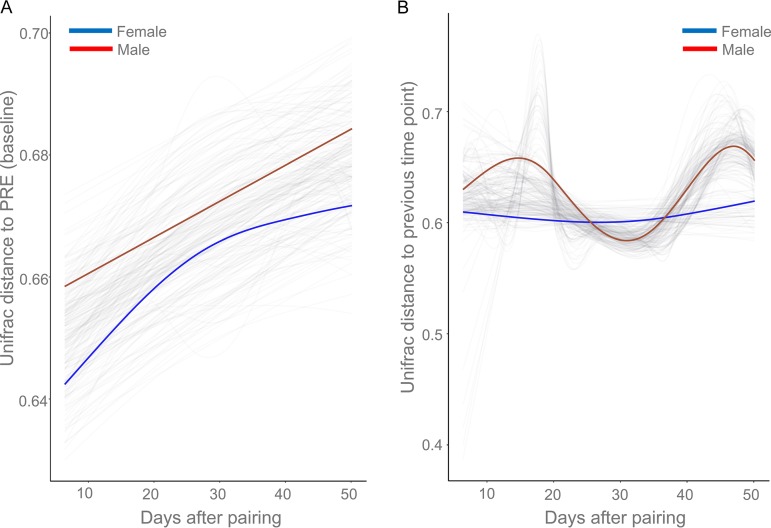
FIG 4.
The permuspliner plots exhibited that males (red line) and females (blue line) differed in the longitudinal change in unweighted UniFrac distances from the PRE stage for each individual (A) and between successive samples collected from the same individual after pairing (B). The translucent lines represent the permuted splines with 99 random permutations. The lines represent the group splines for males (red) and females (blue).

