Fig. 4.
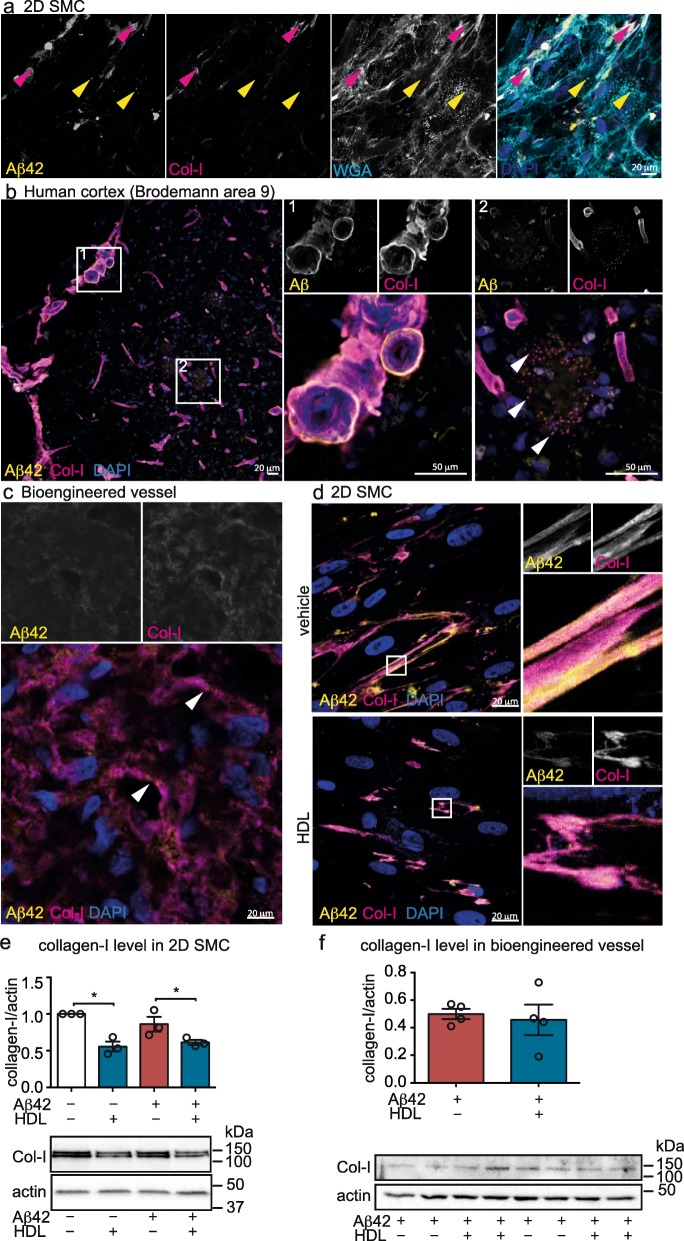
Aβ42 binds to collagen-I in the vascular wall of post-mortem human brain and in bioengineered vessels and HDL reduces collagen-I level in SMC. a SMC were grown for 1 d in chamber slides before treating with 0.5 μM FITC-Aβ42 (yellow) and 200 μg/ml HDL. After 24 h, cells were fixed and cell membranes were stained using wheat germ agglutinin (WGA, magenta) and an antibody against collagen-I (cyan) was used to stain the ECM. Yellow arrows show intracellular Aβ42 and magenta arrows show collagen-I/Aβ42 co-localization. b Human cortex (Brodmann area 9) from four donors was stained for Aβ using 6E10 (yellow) and collagen-I (magenta) and expanded views of vascular (1) and cortical (2) Aβ fibrillar plaques are presented on the right. c Bioengineered vessels treated with Aβ42 monomers for 24 h were stained for collagen-I (yellow) and Aβ (6E10, magenta). White arrows show co-localization of collagen-I and Aβ42. d SMC were grown on 2D coverslips for 24 h before incubating with 0.5 μM FITC-Aβ42 (yellow) and 200 μg/mL HDL. SMC were then fixed and stained for collagen-I (magenta). Details of collagen-I fibres and Aβ42 co-localization are presented on the right. e SMC were grown for 24 h in 2D culture before treating with 1 μM Aβ42 with or without 200 μg/mL HDL. After 24 h, cells were lysed, collagen-I expression was measured by Western blot and normalized to actin levels. f Bioengineered vessels were treated with 1 μM Aβ42 and 200 μg/mL HDL as above. After 24 h, bioengineered vessels were lysed in RIPA and collagen-I levels were measured by Western blot and normalized to actin levels. All images are representative of at least 3 individual experiments or 4 donors and were imaged using confocal microscopy. Points in graphed data represent individual bioengineered vessels, bars represent mean, error bars represent ±SEM and analysed by Student’s t-test *P < 0.05

