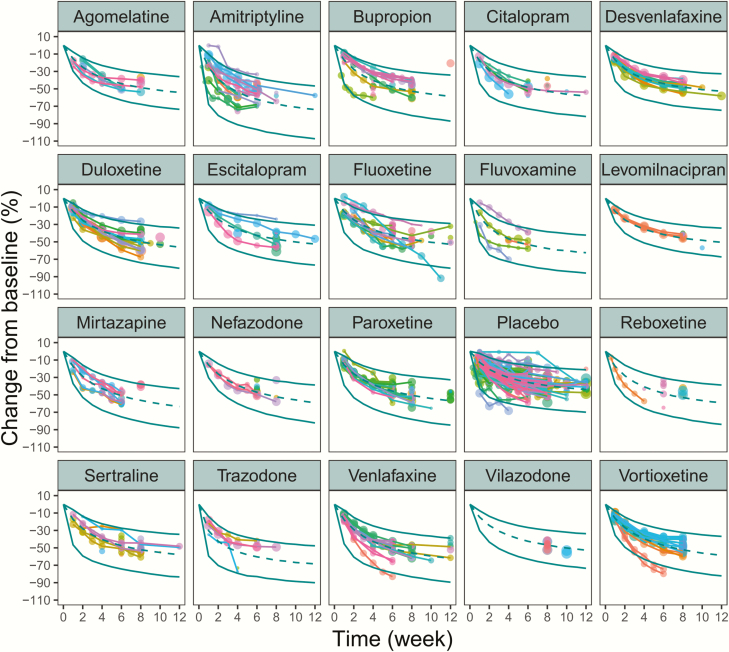
Figure 2.
Visual predictive check of the final model for each treatment. The points represent the observed efficacy data and the symbol size is proportional to the sample size. The solid lines are the model predicted 95% confidence interval (CI) of each treatment. The dotted line is the median value of the model predicted efficacy.

