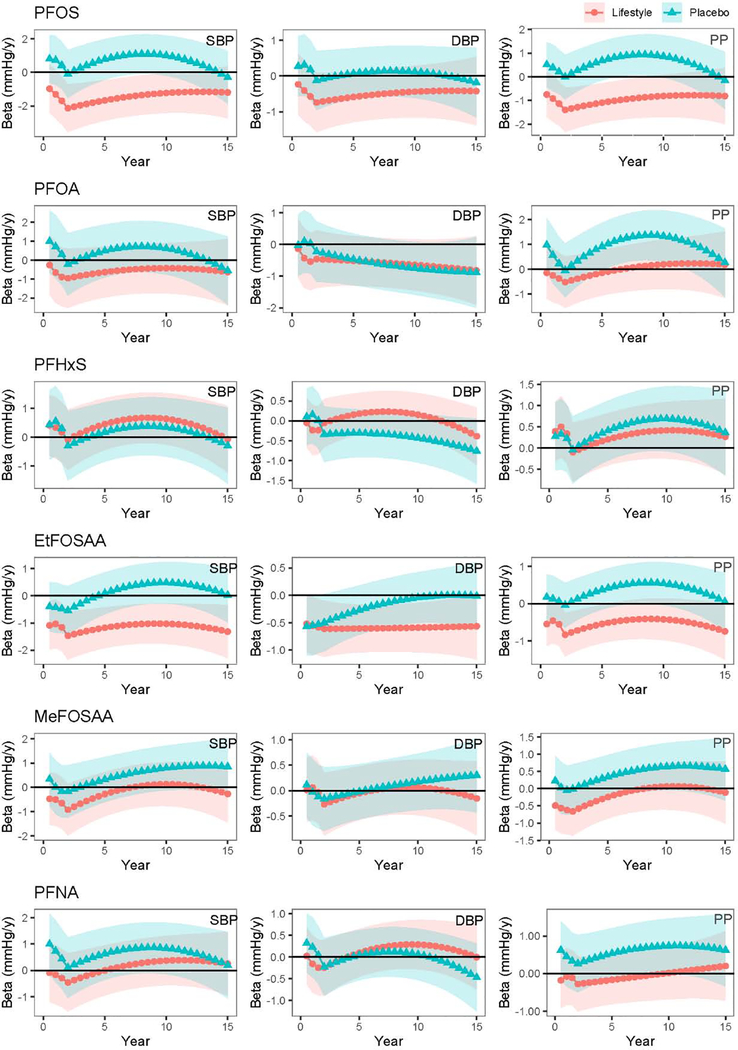
Figure 2.
Longitudinal associations between baseline plasma PFAS concentrations and BP trajectories over 15 years of follow-up in DPP/DPPOS (N=940)
Note: Effect estimates (markers) and 95% confidence interval (band) are interpreted as rate of blood pressure change (mmHg/y) per doubling of plasma PFAS concentrations measured at baseline. All models adjusted for age, sex, race, treatment assignment, education, income, marital status, alcohol drinking, smoking, and DASH diet score.

