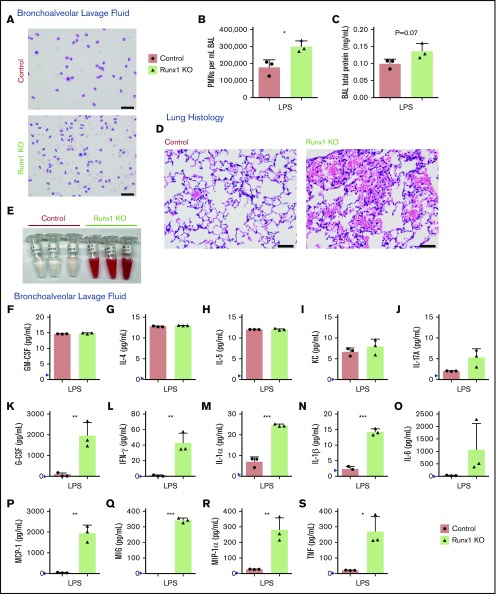
Figure 3.
Increased activation of Runx1 KO neutrophils in vivo in response to TLR4 stimulation. (A-C) Data derived from mice in 1 experiment exposed to nebulized LPS simultaneously for 30 minutes and harvested 24 hours later (n = 5 for each genotype). Three mice were used for BAL analysis, and 2 mice were used for lung histology from each genotype. (A) Representative cytospins of BAL fluid used to quantify the differential inflammatory infiltrates (n = 3). Scale bars, 50 μm; Hema 3 stain. (B) Absolute neutrophil counts in BAL fluid determined by calculating white blood cell count and multiplying it by the percent PMNs determined from the cytospins (n = 3, mean ± SD, unpaired 2-tailed Student t tests). (C) Quantification of BAL fluid total protein levels (n = 3). (D-S) Data from a second experiment in which mice were exposed to LPS simultaneously and harvested 24 hours later (n = 5 for each genotype). Three mice were used for BAL analysis, and 2 mice were used for lung histology from each genotype. Four out of 5 Runx1 KO mice in this experiment had profound alveolar hemorrhage indicated by either BAL appearance (3/3) or lung histology (1/2). (D) Lung histology showing degree of inflammatory infiltrate, alveolar hemorrhage, and gross damage (n = 2). Second Runx1 KO replicate for this experiment is shown in supplemental Figure 5B. Scale bars, 50 μm; hematoxylin and eosin stain. (E) Gross appearance of BAL fluid (n = 3). (F-S) Absolute quantification by CBA of inflammatory factor levels in the BAL fluid (mean ± SD). Three replicates were performed for each condition with all results above the limit of detection (blue arrowhead) plotted. For all factors except MIG (Q), a 2-tailed unpaired Student t test was performed. Because of limited detection of MIG in the control BAL fluid (Q), a 1-sample Student t test was performed comparing the mean of the Runx1 KO BAL fluid to a hypothetical mean = 0. *P ≤ .05; **P ≤ .01; ***P ≤ .001. GM-CSF, granulocyte-macrophage colony-stimulating factor.

