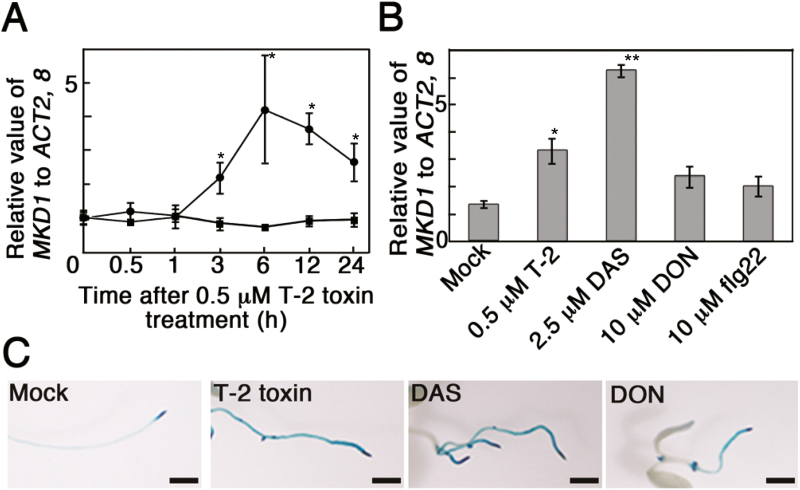
Figure 2.
Induction of MKD1 mRNA by trichothecenes. (A) Expression levels of MKD1 after T-2 toxin treatment were analysed by RT-qPCR. Circles and squares show the data from T-2 toxin- and mock-treated samples, respectively. Data points represent the mean ±SD (n=3). *P<0.05, based on Student’s t-test. (B) Expression levels of MKD1 6 h after DAS, DON, or flg22 treatment were analysed by RT-qPCR. Data points represent means ±SD (n=5). *P<0.05, **P<0.01, based on Student’s t-test. Similar results were obtained in three independent experiments. (C) Representative photos of GUS staining in PMKD1:GUS plants grown on MS agar medium with or without trichothecene (T-2 toxin, DAS, or DON). Scale bars: 1 mm. Similar results were obtained for more than 10 transgenic plants with each trichothecene treatment. (This figure is available in color at JXB online.)

