Figure 3.
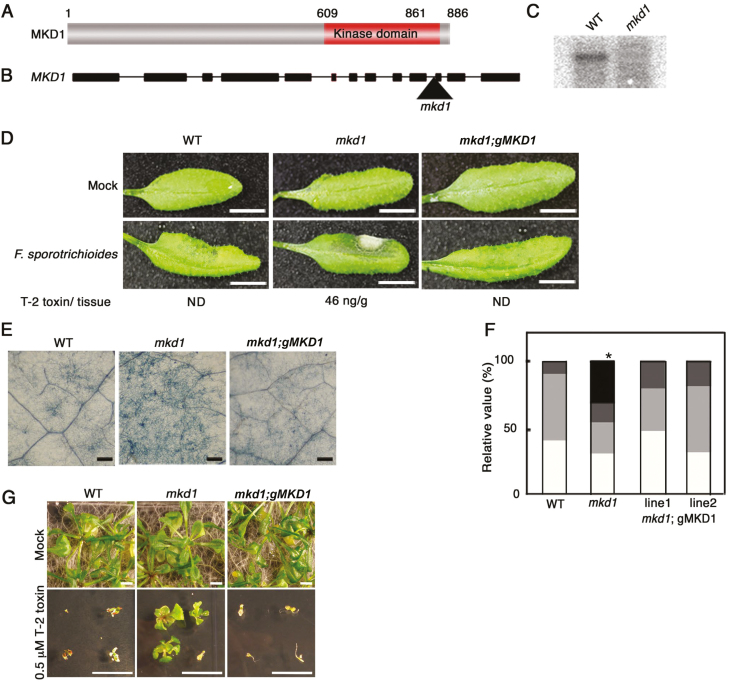
MKD1 is involved in disease resistance against bacterial and fungal phytopathogens. (A) Schematic structure of the MKD1 protein. (B) Position of the T-DNA insertion in the mkd1 mutant. Boxes show exons. Triangle indicates the insertion position of the T-DNA. (C) RNA gel blot analysis of MKD1 mRNA in WT and the mkd1 mutant. (D) Representative images of WT, the mkd1 mutant, and the complementation line (mkd1;gMKD1 transgenic plants) 2 d after inoculation with F. sporotrichioides conidia. Scale bars: 1 cm. T-2 toxin/tissue indicates the concentration of T-2 toxin in leaves. ND: not detected. Similar results were obtained in three independent experiments. (E) Trypan blue staining of F. sporotrichioides-inoculated leaves after 2 d. Scale bars: 100 µm. (F) Relative values for the classification of disease symptoms in F. sporotrichioides-inoculated leaves (n=17–30). The bars show disease severity. White (class 1): normal, light gray (class 2): leaf turned black; dark gray (class 3): partial hyphae; black (class 4): expanded aerial hyphae. *P<0.05, based on Man–Whitney U-test. (G) Representative photos of WT and mkd1 mutant; the complementation lines were grown on MS agar medium with or without 0.5 µM T-2 toxin for 2 weeks. Similar results were obtained in three independent experiments. Scale bars: 1 cm.

