Figure 5.
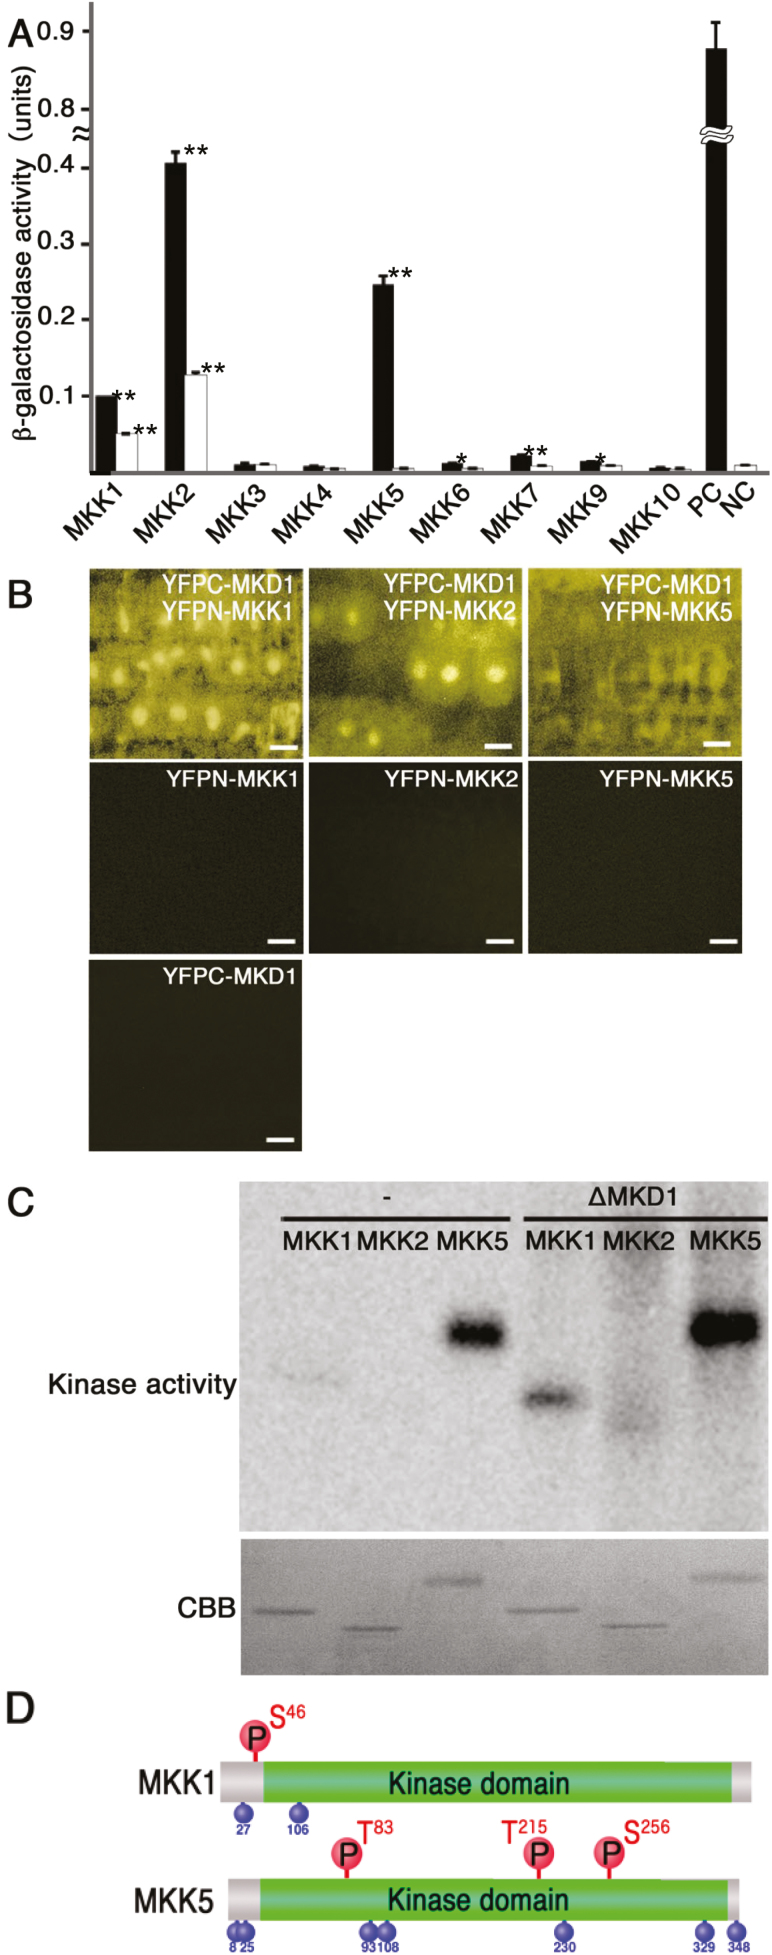
Downstream MKKs of the MKD1-dependent signaling cascade. (A) Protein–protein interactions between MKD1 and MKKs were examined by yeast two-hybrid analysis. The interactions were evaluated by β-galactosidase activity units per number of cells and incubation time. Black and white bars represent the values observed for the full-length MKD1 and for the kinase domain of MKD1, respectively. Results shown are means ±SD (n=3). *P<0.05, **P<0.01, based on Student’s t-test. Similar results were obtained in three independent experiments. (B) In vivo interactions of MKD1 with MKK1, MKK2, and MKK5 were examined by BiFC analysis. Images show the YFP signal in the root tip. Scale bars: 10 µm. Similar results were obtained in two independent experiment. (C) Phosphorylation of MKK1, MKK2, and MKK5 by constitutively active MKD1 (ΔMKD1) investigated by in vitro kinase assays. −, without ΔMKD1. (D) Phosphorylation sites on MKK1 and MKK5 targeted by MKD1. Phosphorylation sites targeted by MKD1 are shown above; autophosphorylation sites are shown below. S, serine; T, threonine. (This figure is available in color at JXB online.)

