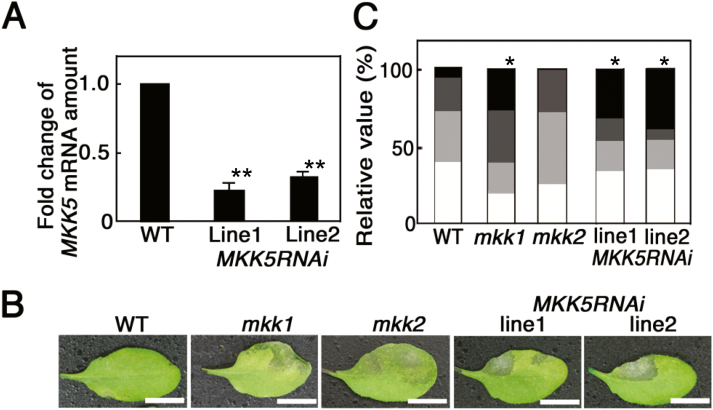
Figure 6.
Resistance of mkk1, mkk2, and MKK5RNAi transgenic plants against F. sporotrichioides. (A) Suppression of MKK5 mRNA in MKK5RNAi transgenic plants grown on MS medium containing 0.5 µM T-2 toxin. Amounts of MKK5 mRNA were normalized against ACTIN2, 8. MKK5 mRNA levels in MKK5RNAi transgenic plants are represented as fold changes of the WT level (n=5).**P<0.01, based on Student’s t-test. Similar results were obtained in two independent experiment. (B) Representative images of WT, mkk1, mkk2, and MKK5RNAi leaves 2 d after inoculation with F. sporotrichioides. Similar results were obtained in three independent experiments. Scale bars: 1 cm. (C) Relative values for the classification of disease symptoms (n=17–30). Bars describe data as explained in Fig. 3F.*P<0.05, based on Man–Whitney U-test. (This figure is available in color at JXB online.)

