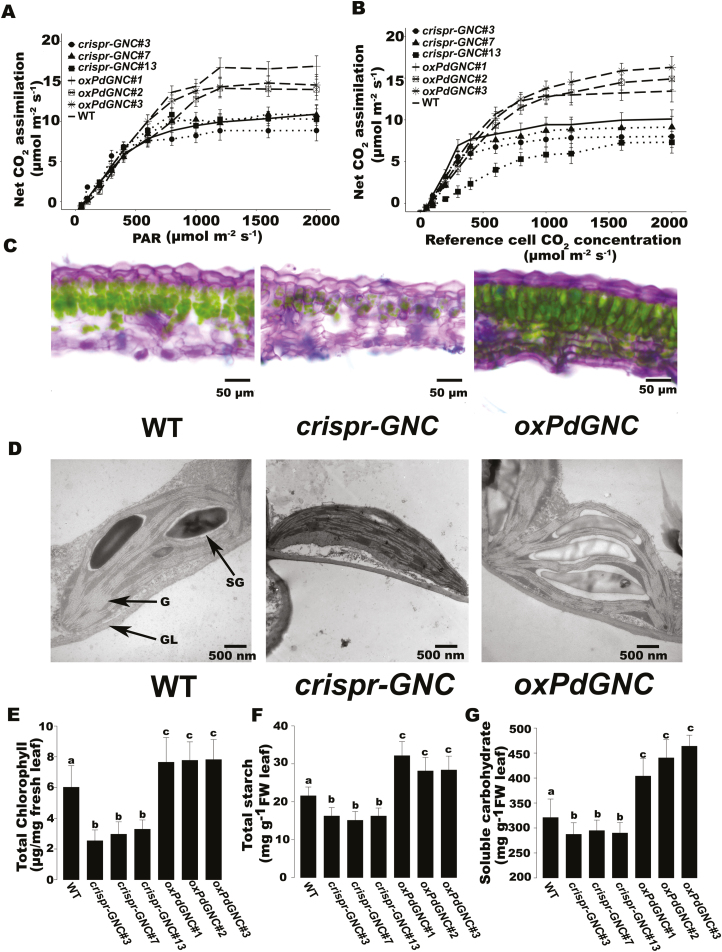
Fig. 5.
Photosynthesis and chlorophyll content modulated by PdGNC. (A) A–Ci curve. (B) A–light response curve. (C) Transverse sections of the fifth functional leaf. Scale bar=50 μm. (D) Chloroplast ultrastructure. Scale bar=500 nm. G, grana; GL, grana lamellae; SG, starch granules. The data are the mean ±SD (n=10). Bars with different letters indicate a significant difference (P<0.05; one-way ANOVA). (E) Total chlorophyll content of leaves. (F) Total starch content of leaves. (G) Soluble carbohydrate content of leaves.

