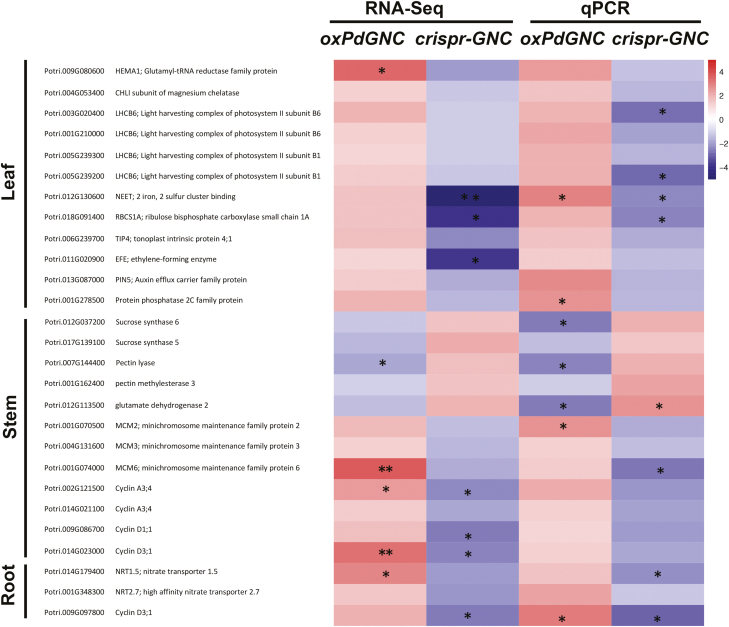
Fig. 8.
Heatmap of expression profiles of differentially expressed genes between PdGNC-overexpression (oxPdGNC), crispr-GNC, and wild type plants. qPCR was used to analyse expression levels of genes differentially expressed in the leaf, stem, and root. Asterisks indicate a significant difference (*P<0.05, **P<0.01; one-way ANOVA).

