Fig. 1.
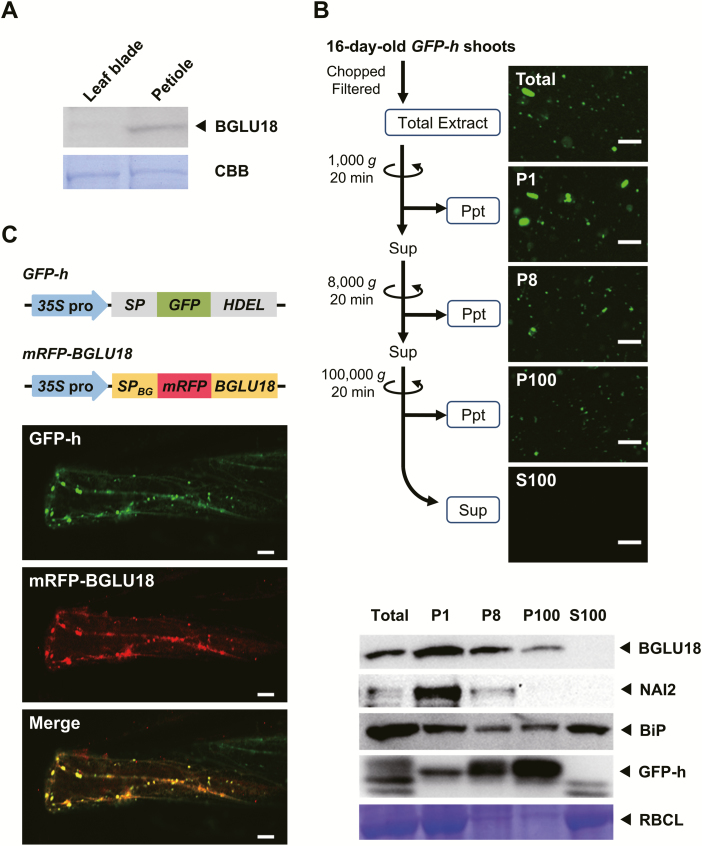
Tissue distribution and subcellular localization of BGLU18 in Arabidopsis leaves. (A) Tissue distribution within true leaves. Immunoblotting analysis was performed with anti-BGLU18 antibodies using 30 μg of total protein extracted from leaf blades and petioles of 14-day-old plants grown under normal conditions. (B) Subcellular distribution of BGLU18 as determined by biochemical fractionation. The upper panel shows the fractionation scheme and typical fluorescence images of subcellular fractions prepared from shoot extracts of GFP-h plants. P1, P8, and P100 indicate pellets (Ppt) obtained after centrifugation at 1000, 8000, and 100 000 g, respectively, and S100 indicates the supernatant (Sup) after centrifugation at 100 000 g. Scale bars=20 μm. The lower panel shows typical immunoblotting results for the distribution of BGLU18, NAI2, BiP, and GFP-h in the subcellular fractions. The large subunit of RBC (RBCL) was stained with Coomassie brilliant blue (CBB). Analyses were conducted on a volume to volume basis. (C) Subcellular localization of the mRFP–BGLU18 fusion protein, as determined by confocal laser-scanning fluorescence microscopy. Above, GFP and mRFP fusion constructs used to visualize ER/ER bodies and BGLU18, respectively. 35S pro, Cauliflower mosaic virus 35S promoter; SP, signal peptide from pumpkin 2S albumin; GFP, green fluorescent protein; HDEL, ER retention signal; SPBG, signal peptide from BGLU18; mRFP, monomeric red fluorescent protein; BGLU18, mature polypeptide of BGLU18. Below, representative fluorescence images of leaf petiole epidermal cells of a GFP-h plant transiently expressing BG1-mRFP by particle bombardment. Scale bars=20 μm. All experiments were repeated three times to confirm the reproducibility of the results, and one representative result is shown.

