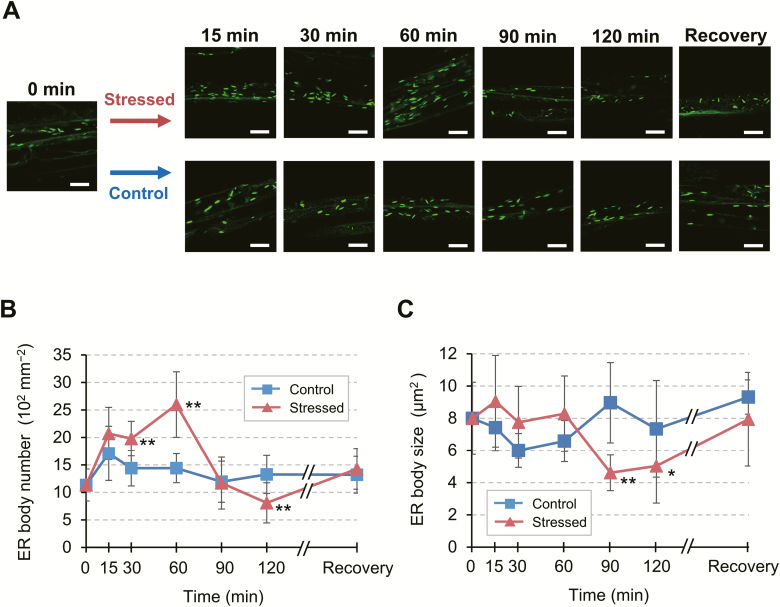
Fig. 4.
Dynamic changes in leaf petiole ER bodies in response to drought-induced dehydration stress. (A) Representative time-course fluorescence images of leaf petiole epidermal cells of a GFP-h plant exposed to dehydration stress. Aseptically grown plants were subjected to dry air for the indicated time period up to 120 min. For recovery, stressed plants were restored to normal conditions and grown for an additional 18 h. Scale bars=20 μm. (B and C) Time-course of changes in the number (B) and average size (C) of ER bodies. Two-dimensional sizes of individual ER bodies, as indicated by green spot areas, were determined as described in the Materials and methods. Data are means ±SD (n=4 in B; n=5 in C; *P<0.05; **P<0.01 by Student’s t-test compared with the control at the same time point).

