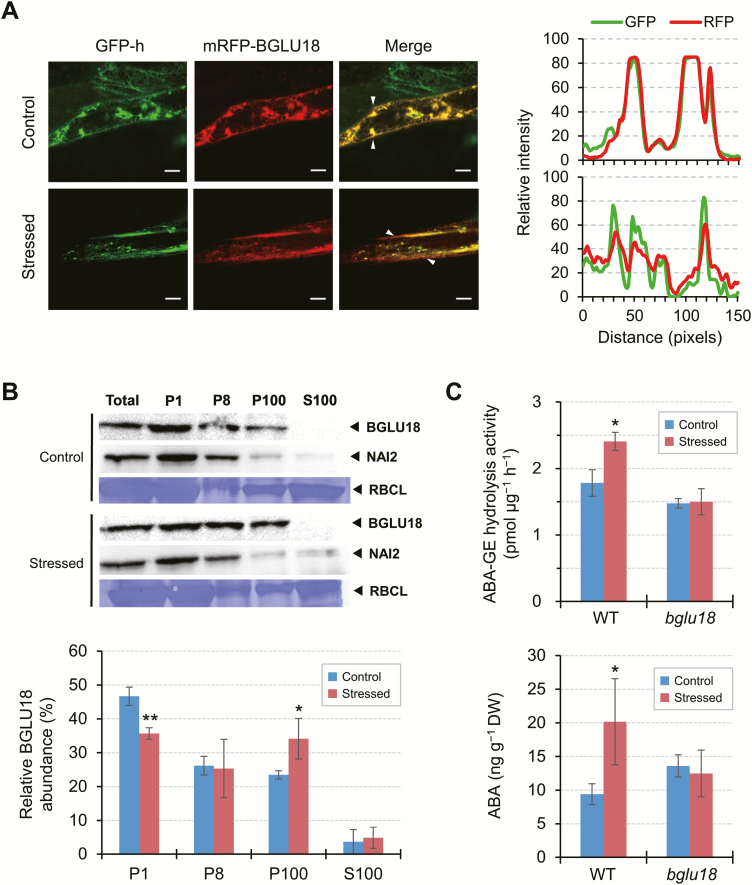
Fig. 6.
Effects of drought-induced dehydration on the subcellular distribution and ABA-GE hydrolysis activity of BGLU18 and ABA levels in leaf petioles. (A) Left: representative fluorescence images of leaf petiole epidermal cells transiently expressing mRFP-BGLU18 in GFP-h plants under control or stress conditions (as in Fig. 4 for 30 min). Scale bars=20 μm. Right: line profile graphs showing relative pixel intensities for GFP (green) and mRFP (red) fluorescence (upper, control; lower, stressed), which were line-scanned and quantified between the two white arrowheads in the merged panels on the left using ImageJ. (B) Subcellular distribution of BGLU18. Biochemical fractionation followed by immunoblotting was performed starting with control plants and plants exposed to dehydration for 30 min. Bar graphs below show the relative distribution of BGLU18 in the four fractions. (C) ABA-GE hydrolysis activity (upper) and ABA levels (lower) in WT and bglu18 plants under control conditions or exposed to dehydration for 30 min. Leaf petioles were collected from control and dehydration-stressed plants of each genotype and assayed for ABA by LC-ESI-MS/MS on a DW basis. Data are means ±SD (n=3 in both B and C). Significant differences between treatments are indicated by asterisks (*P<0.05; **P<0.005 by Student’s t-test).

