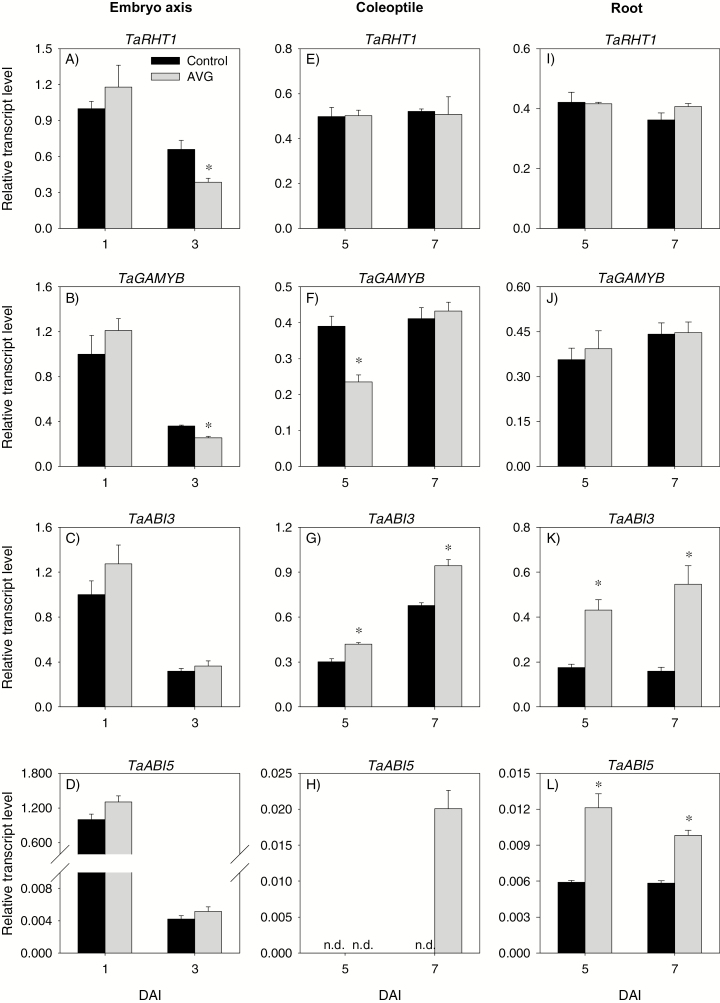
Fig. 11.
Expression patterns of gibberellin and abscisic acid signaling genes in the embryo axis, coleoptile, and root of post-germination seedlings. Transcript levels of TaRHT1 (A, E, and I), TaGAMYB (B, F, and J), TaABI3 (C, G, and K), and TaABI5 (D, H, and L) were determined in AVG-treated samples and their respective controls exactly as described in Fig. 3 and expressed relative to their respective transcript levels in the control embryo axis at 1 DAI, which were set to a value of 1. Data descriptions are as shown in Fig. 3. DAI, day(s) after imbibition; n.d., not detected.

