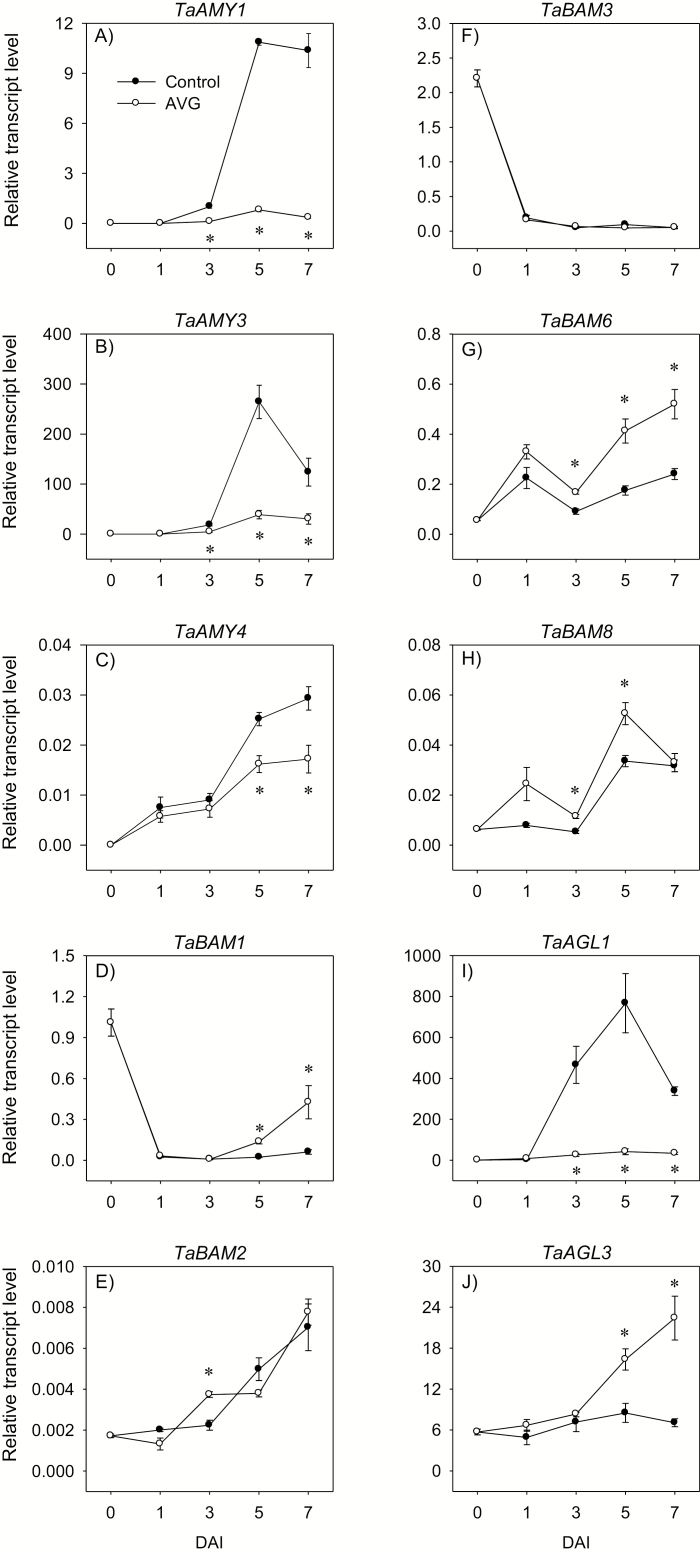
Fig. 3.
Expression patterns of starch-degrading genes in the endosperm during imbibition. Relative transcript levels of TaAMY (A–C), TaBAM (D–H), and TaAGL (I, J) genes in AVG-treated samples and their respective controls. Transcript levels of TaAMY, TaBAM, and TaAGL genes were determined using Taβ-actin as a reference gene and expressed relative to the transcript levels of TaAMY1 in the control endosperm at 3 DAI, and the transcript levels of TaBAM1 and TaAGL1 in the control endosperm at 0 DAI, respectively, which were set to a value of 1. Data are means of three biological replicates ±SE. Asterisks indicate statistically significant differences in expression levels between control and AVG-treated samples (P<0.05; Student’s t-test). DAI, day(s) after imbibition.

