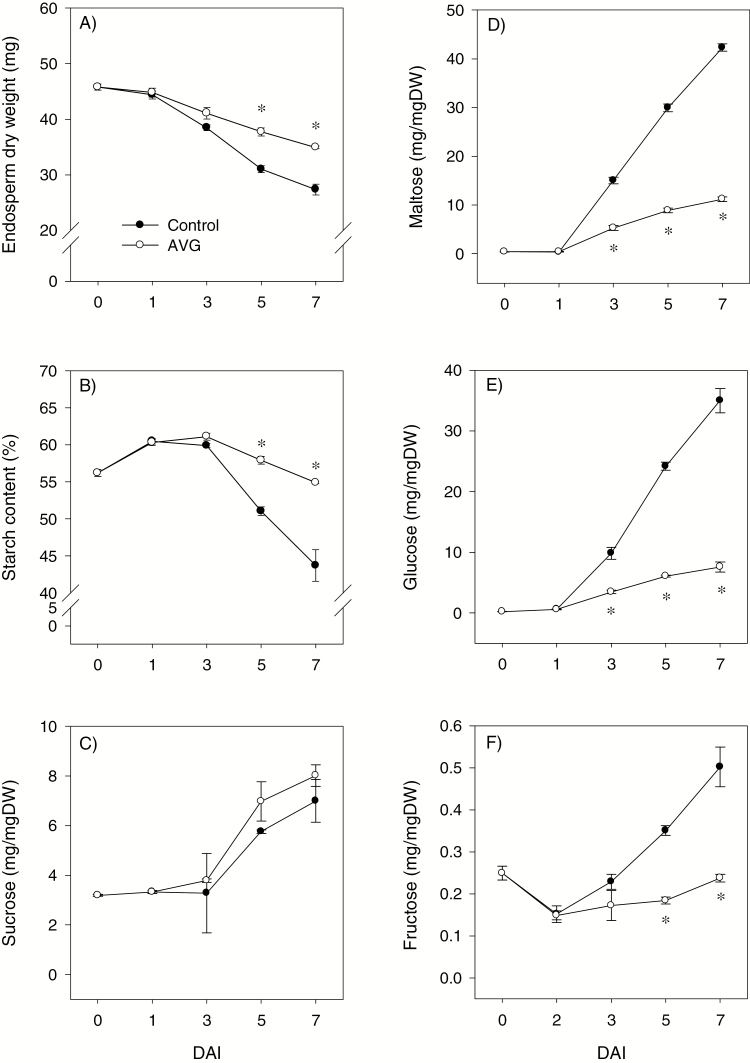
Fig. 5.
Endosperm dry weight and starch and soluble sugar contents during imbibition. Dry weight (A), and contents of starch (B), sucrose (C), maltose (D), glucose (E), and fructose (F) in AVG-treated samples and their respective controls. Data are means of three biological replicates ±SE. Asterisks indicate statistically significant differences in dry weight and starch and soluble sugar contents between control and AVG-treated samples (P<0.05; Student’s t-test). DAI, day(s) after imbibition.

