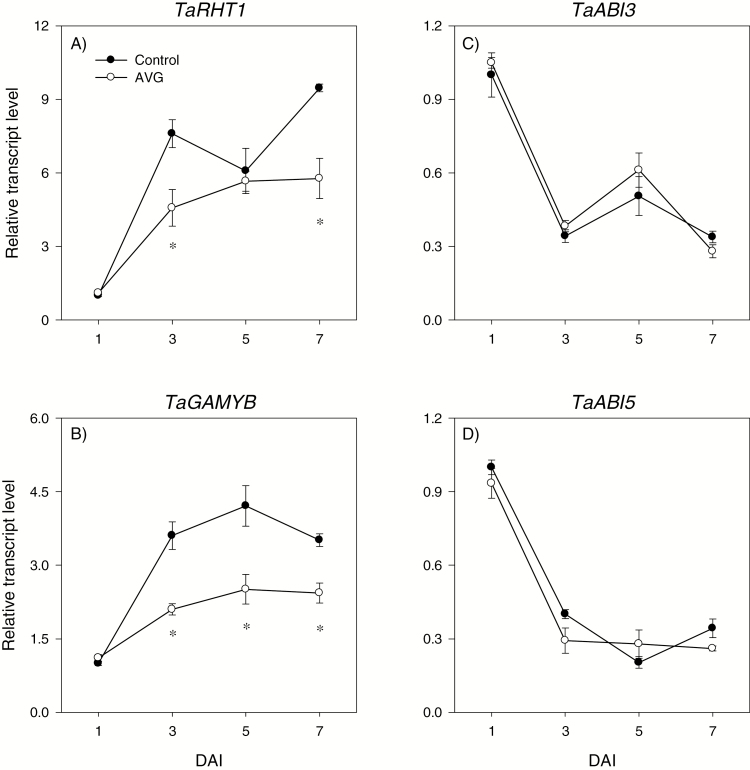
Fig. 8.
Expression patterns of gibberellin and abscisic acid signaling genes in the endosperm during imbibition. Transcript levels of TaRHT1 (A), TaGAMYB (B), TaABI3 (C), and TaABI5 (D) were determined in AVG-treated samples and their respective controls exactly as described in Fig. 3 and expressed relative to their respective transcript levels in the control endosperm at 0 DAI, which were set to a value of 1. Data descriptions are as shown in Fig. 3. DAI, day(s) after imbibition.

