
Fig. 6.
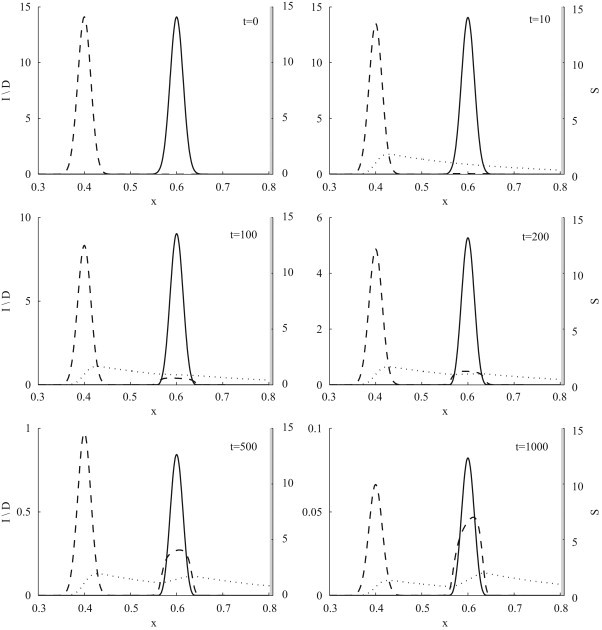
Model dynamics of an influenza outbreak driven by the convection of droplets, with respirable droplet diameter and ventilation velocity v=0.2 m s−1. The graphs show the density of susceptibles (solid line) on the right vertical axis. The densities of infected individuals (dashed line) and droplets (dotted line) are shown on the left vertical axis. Initial conditions are , and with k=50. All variables are dimensionless and scaled following (6).