
Fig. 4.
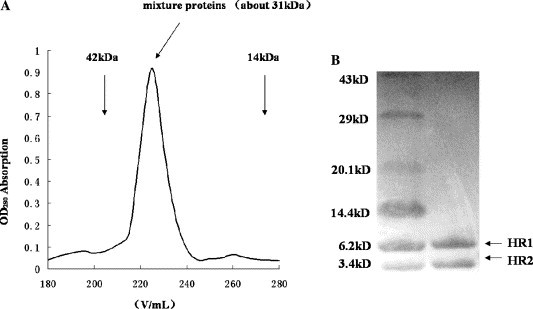
Gel-filtration analysis of the APMV-2HR1 and HR2 protein (complex) mixtures. (A) On the Superdex G100 column a clear peak was eluted between the eluted volumes corresponding to 42 and 14 kDa standards, about 31 kDa. (B) Inset picture indicates SDS–PAGE analysis of the peak, the two proteins of equivalent concentrations whose molecular weights matched the HR1 and HR2 monomer, respectively, indicating the formation of the heterotrimer structure (31 kDa is the approximate sum of three molecular HR1 and three molecular HR2).