
Fig. 4.
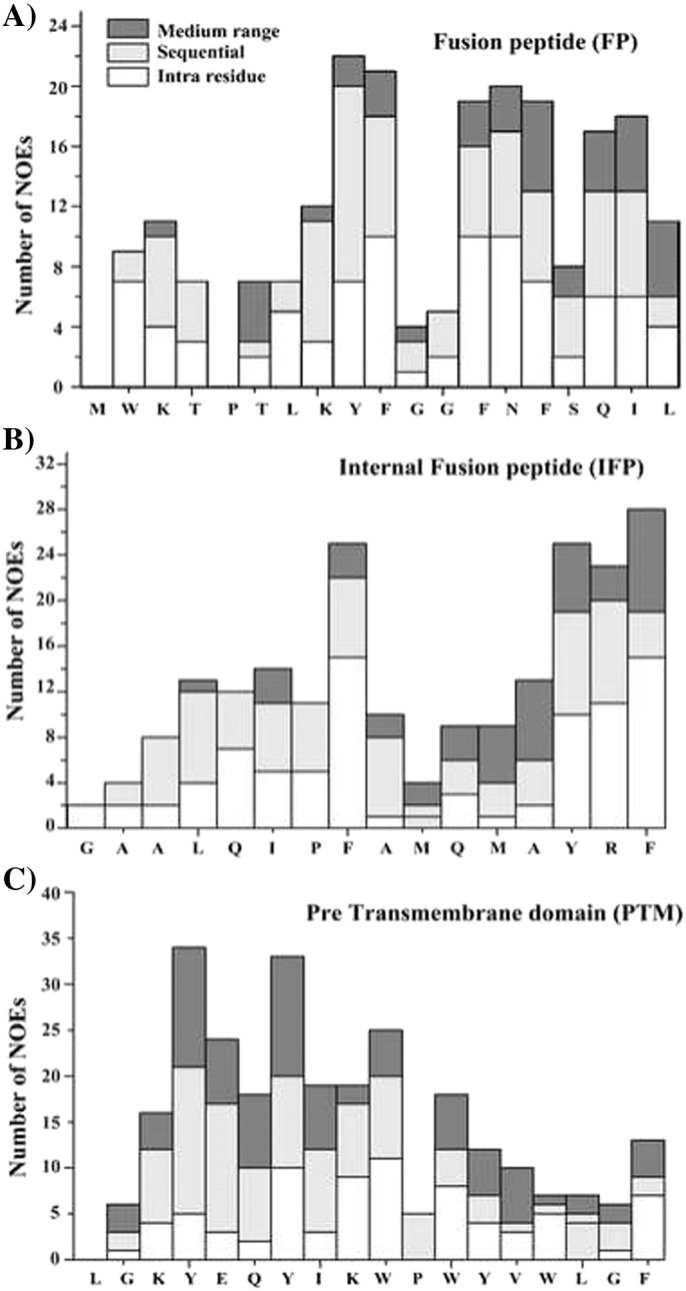
Bar diagram summarizing number and types of NOEs for FP (panel A), IFP (panel B) and PTM (panel C). Intra-residue, sequential and medium range NOEs are marked as white, light gray and dark bars, respectively.
Official websites use .gov
A
.gov website belongs to an official
government organization in the United States.
Secure .gov websites use HTTPS
A lock (
) or https:// means you've safely
connected to the .gov website. Share sensitive
information only on official, secure websites.
Bar diagram summarizing number and types of NOEs for FP (panel A), IFP (panel B) and PTM (panel C). Intra-residue, sequential and medium range NOEs are marked as white, light gray and dark bars, respectively.