
Figure 3.
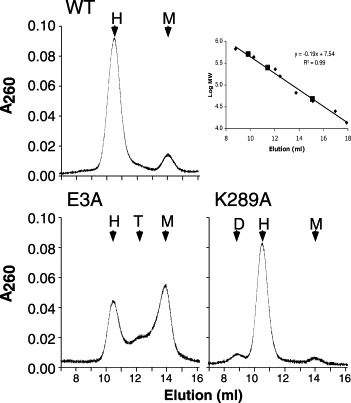
Gel-filtration of Nsp15. Elution profiles for wild-type (WT) Nsp15 and mutant versions E3A and K289A. Molecular masses were calculated relative to native molecular mass markers as shown in the inset. The expected positions for hexamer (H), trimer (T) and monomer (M) are shown in each panel where relevant. The elution profiles for four inactive mutants (E210A, H249A, and D272A) and two mutants with wild-type activity (E56A and D212A) were similar to WT, and were omitted from the Figure for simplicity. Mutant H234A was also similar to WT, although the monomer proportion was higher. The inset shows the standard curve for the protein markers (triangles) and the predicted molecular masses for the different forms of Nsp15 (squares).