
Figure 6.
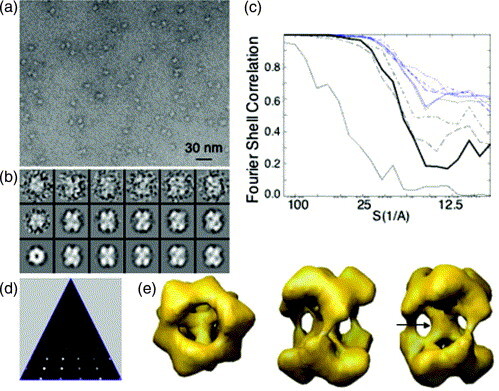
Single-particle analysis. (a) Electron micrograph of negatively stained Nsp15 K289A single particles. (b) Gallery of representative raw particles, class averages, and reprojections (from left to right). Boxes measure 40×40 pixels. (c) FSC plots demonstrating the progressive convergence during the refinement process. The bold line shows the resolution assessment in the final 3D reconstruction to be between 1.7 nm and 2 nm as per the 0.5 FSC criterion. (d) An asymmetric triangle depicting anisotropy with regards to the sampling of the 3D space. (e) 3D reconstruction of Nsp15K289A viewed face-on (top) and side-on (bottom). The surface rendering threshold was set to correspond to a molecular mass of 240 kDa. The arrow points at the central density.