Figure 3.

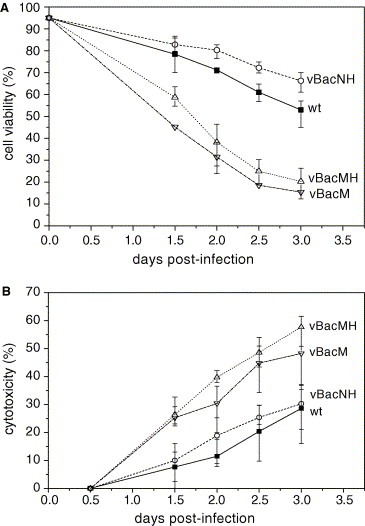
Time‐course profiles of viability (A) and cytotoxicity (B) of the cells infected by wt AcMNPV, vBacNH, vBacM and vBacMH at MOI 10. The data represent the means ± S.D. of four independent experiments.

Time‐course profiles of viability (A) and cytotoxicity (B) of the cells infected by wt AcMNPV, vBacNH, vBacM and vBacMH at MOI 10. The data represent the means ± S.D. of four independent experiments.