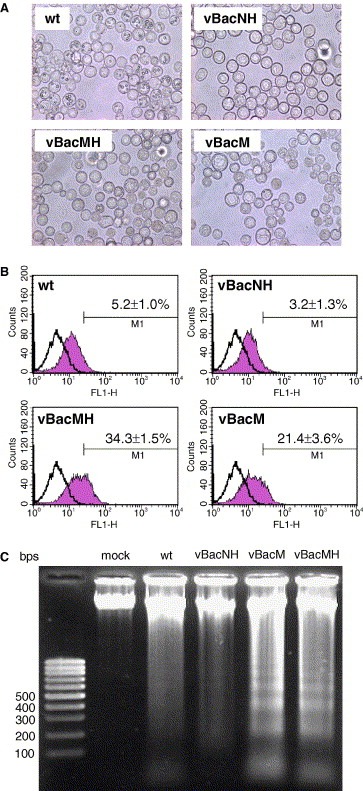
Figure 4.

Induction of apoptosis by vBacMH and vBacM infection of Sf‐9 cells. (A) Photomicrographs showing the cell morphology of Sf‐9 cells at 2 dpi after infection with wt AcMNPV, vBacNH, vBacMH and vBacM at MOI 10. (B) TUNEL staining and flow cytometry analysis of Sf‐9 cells. Sf‐9 cells were mock‐infected or infected as in (A) and subject to TUNEL assay at 2 dpi. Samples were analyzed by flow cytometry and representative experiments are shown. The open and shaded histograms represent the fluorescence intensities of mock‐infected and baculovirus‐infected cells, respectively. The data shown in the figures represent the means ± S.D. of four independent experiments. (C) Cellular DNA fragmentation analysis. The figure is representative of four independent experiments.
